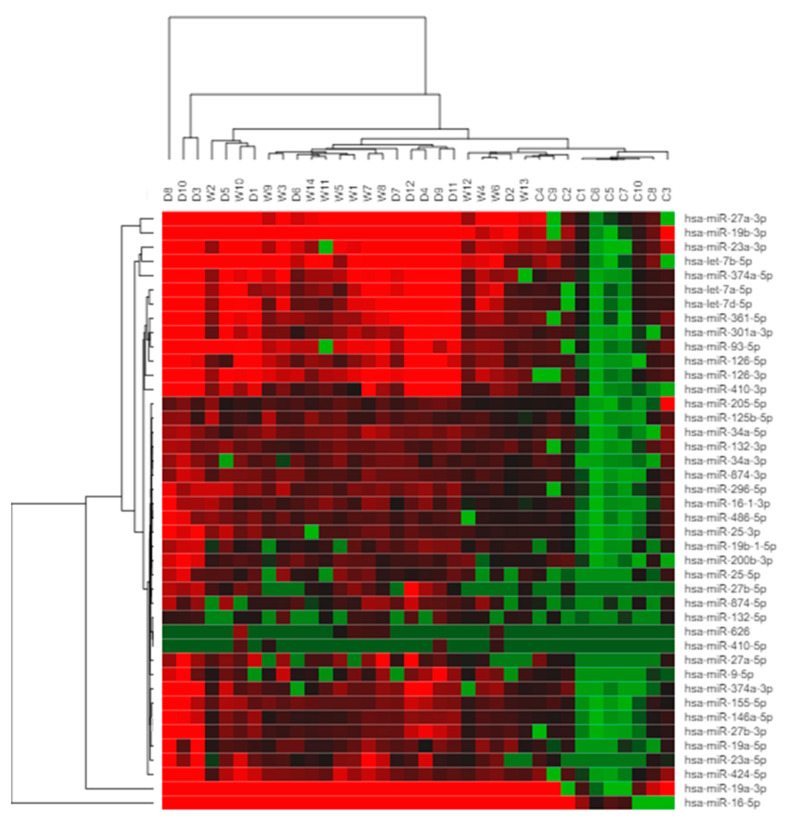
Figure 3.
Hierarchical clustering of differentially regulated miRNAs. The clustering map represents miRNA differential expression in AMD patients and controls. Each row represents one miRNA, and each column represents one sample (dry, wet and control). Red = expression level above the mean, green = expression lower than the mean, (D1, D2, ..., D12 = dry AMD specimens; W1, W2, ..., W14 = wet AMD specimens; C1, C2, ..., C10 = control).

