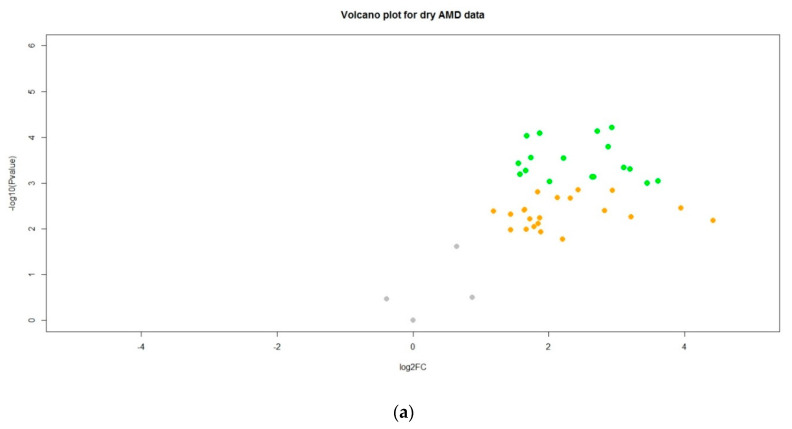
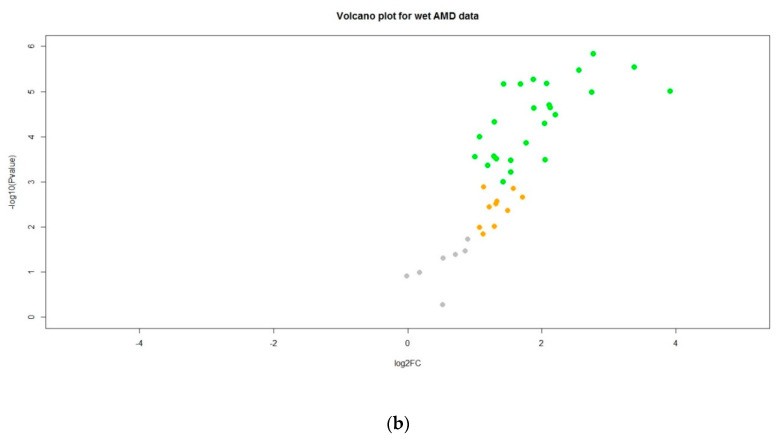
Figure 4.
Volcano plots to show miRNA changes in (a) patients with ‘dry’ AMD and (b) patients with ‘wet’ AMD. Points are grey if there is neither a noticeable fold change in gene production nor a difference in gene expression between the control group and the AMD groups, after adjusting for multiple tests. Points are orange if there is a noticeable fold change in gene production, but no difference in gene expression between the control group and the AMD groups, after adjusting for multiple tests. Points are green if there is a noticeable fold change in gene production and a difference in gene expression between the control group and the AMD groups, after adjusting for multiple tests.


