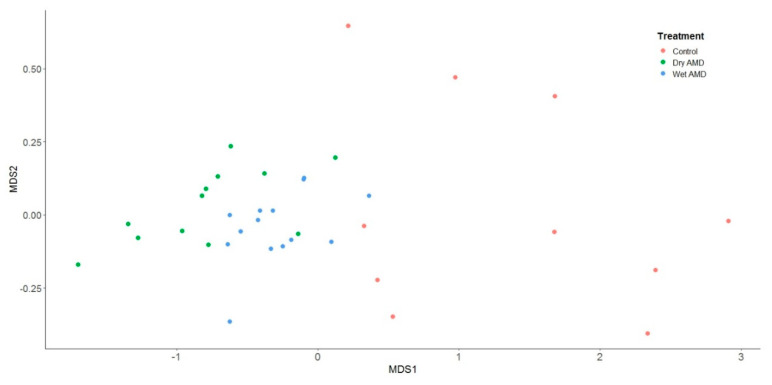
Figure 5.
A multidimensional scaling plot of RQ values for each of the miRNAs under investigation from control patients (orange circles), patients with ‘dry’ AMD (green circles), and patients with ‘wet’ AMD (blue circles). Patients with both ‘dry’ and ‘wet’ AMD provided consistently lower values on the MDS1 axis (equivalent to upregulation of miRNAs). An analysis of variance for the distance matrix (performed by the adonis function within the vegan package in R) demonstrated a significant difference between patient groups (F(2,33) = 12.462, p < 0.01).

