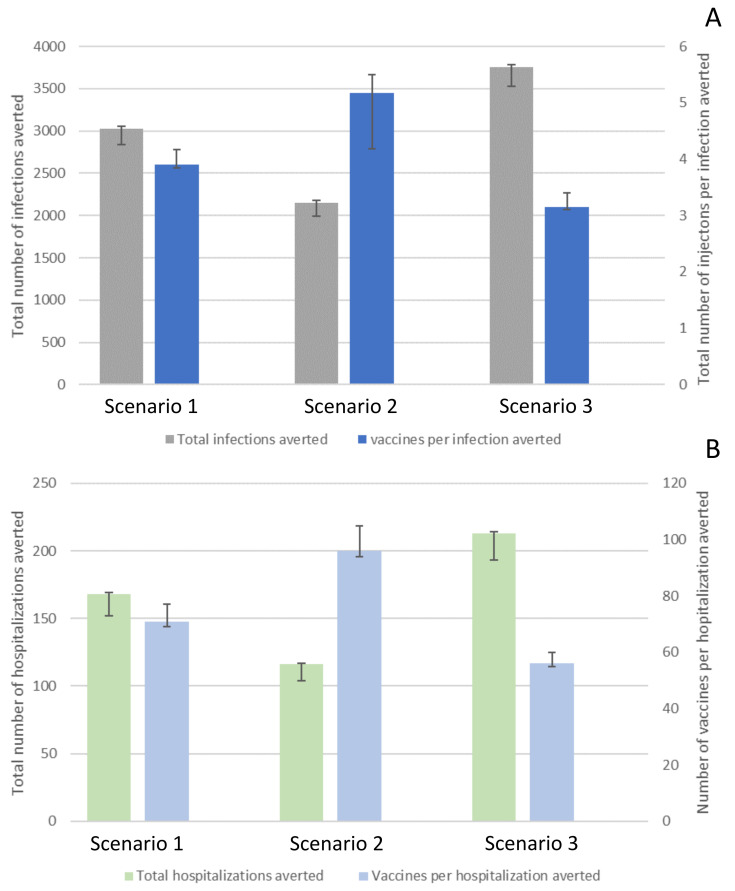
Figure 2.
Impact of different vaccination scenarios on COVID-19-related infections (Panel A) and hospitalizations (Panel B). The effect was defined in averted cases, and the number of vaccinations needed per case/hospitalization averted (i.e., population-level effectiveness of a vaccination program). Scenario 1, one-million vaccine doses were distributed homogeneously across Ohio’s different spatial risk areas. Scenario 2, 60% of all vaccines were administered to Group 3 and Group 4 (i.e., identified as areas with low infection intensity), while 40% of the vaccines were equally distributed across Group 1 and Group 2 (i.e., identified as areas with high infection intensity). Scenario 3, 90% were equally distributed across Group 1 and Group 2, and only 10% of all vaccines were allocated to Group 3 and Group 4.

