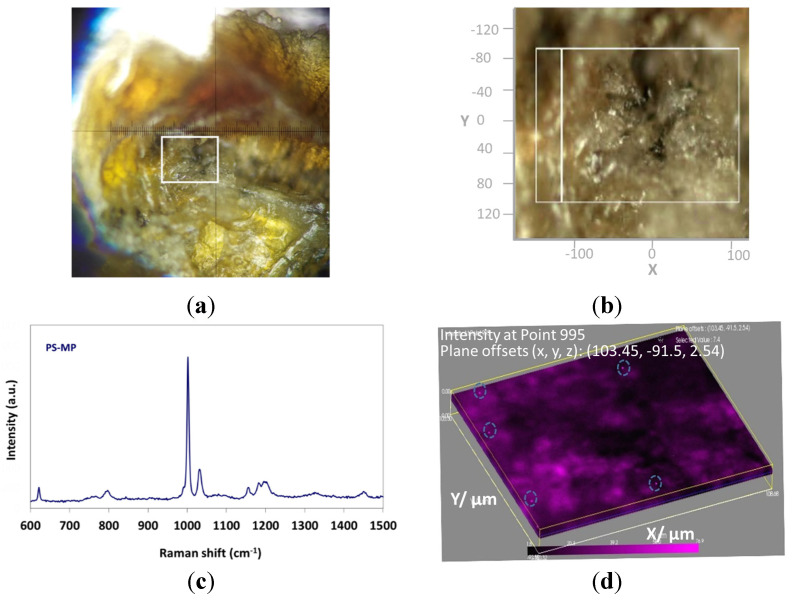
Figure 2.
(a) Zebrafish gill as observed from the microscope lens, indicating the measured area with the white rectangle, (b) The measured area of Figure 2a in the x, y, z axes, (c) Raman spectrum of PS-MS, (d) Still image of the HR volume video map indicating the PS-MS in depth 2.54 μm of the gill area (the HR volume video map can be found in the Supplementary Material).

