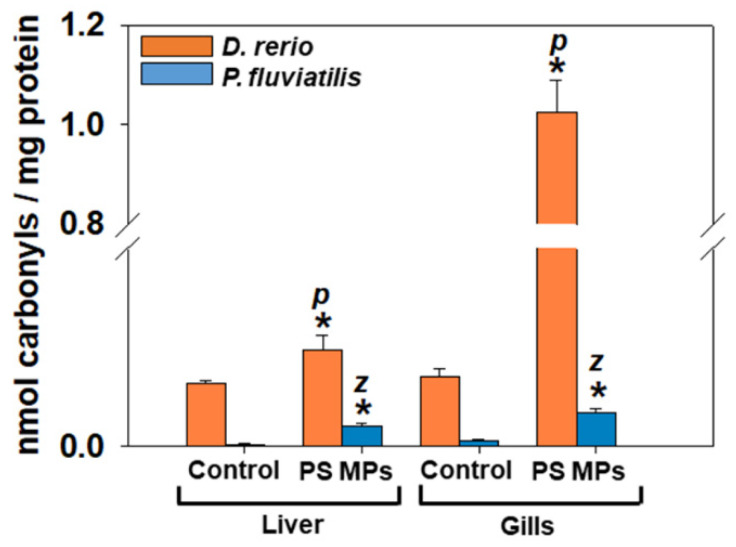
Figure 4.
Protein carbonylation (mean ± SD nmol carbonyls mg−1 protein) in liver and gills of Danio rerio (n = 3 pools of 10 individuals) and Perca fluviatilis (n = 6). The results were expressed as nmol carbonyl groups mg−1 of protein. Mann–Whitney U test was employed to test for significance at p < 0.05 between all experimental groups. * denotes significant differences (p < 0.05) compared to the control group (n = 3 pools of 10 individuals and n = 6 for D. rerio and P. fluviatilis respectively), while z and p denote significant differences (p < 0.05) between D. rerio and P. fluviatilis respectively.

