Figure 2.
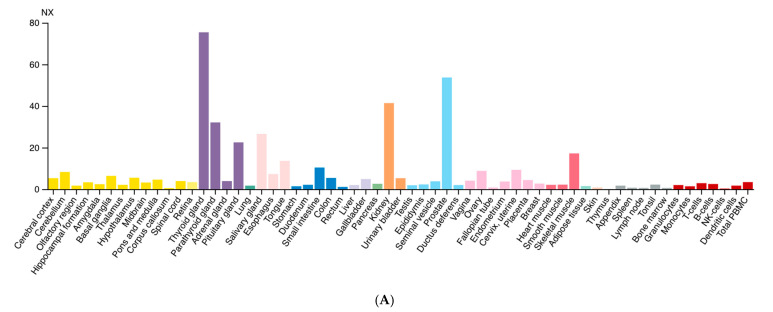
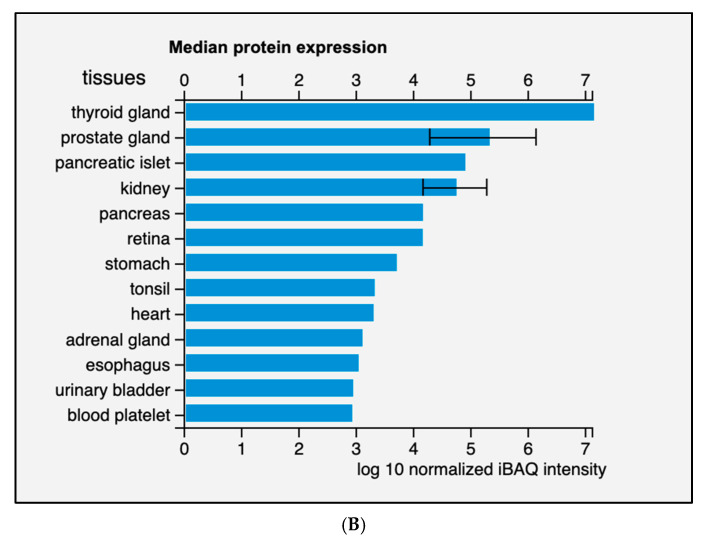
Expression of ARG2 in human tissues. (A) Histogram of the Consensus Normalized eXpression (NX) of ARG2 transcript in human tissues as reported in the Human Protein Atlas v20.1 (https://www.proteinatlas.org/ENSG00000081181-ARG2/tissue; accessed on 31 August 2021). Color-coding is based on tissue groups, each consisting of tissues with functional features in common. (B) Histogram of ARG2 protein expression as reported in Proteomics DB v3.0 (https://www.proteomicsdb.org/; accessed on 31 August 2021) [16,17]. Organ and tissues with the higher protein expression are thyroid and prostate glands, pancreatic islets, kidney, and pancreas. iBAQ: intensity Based Absolute Quantification.


