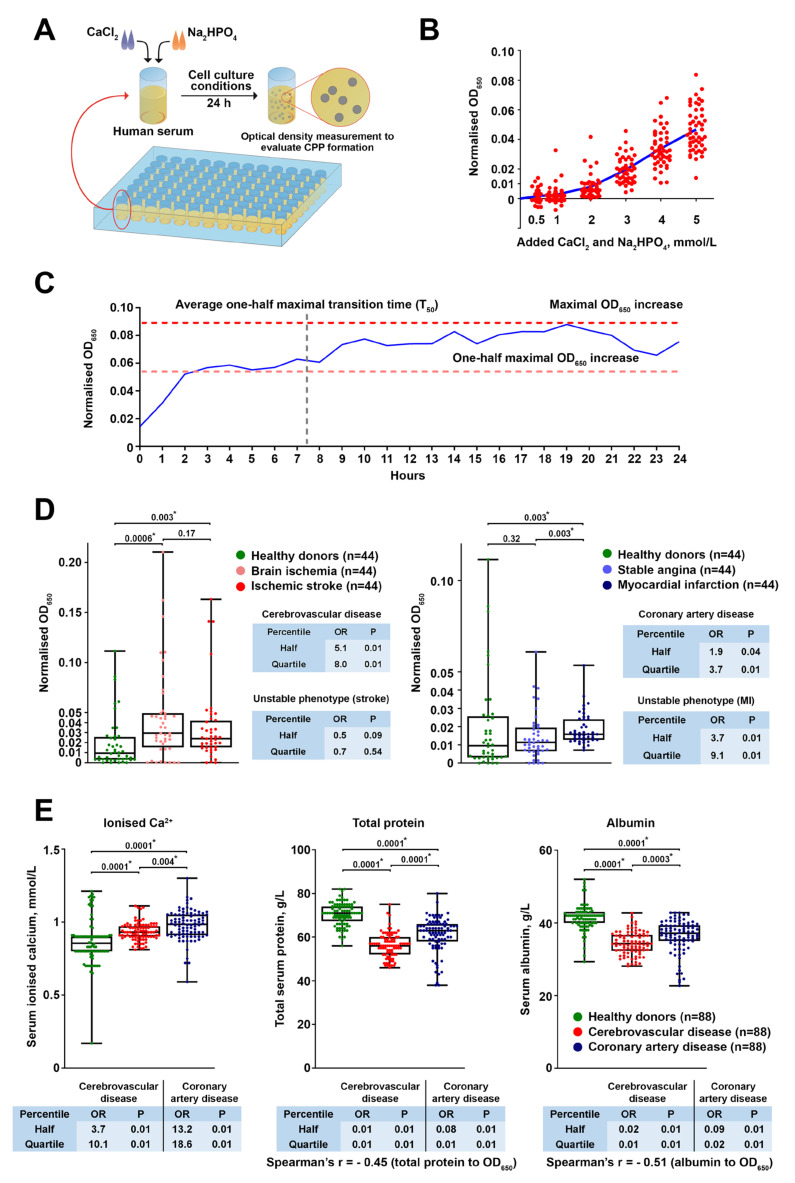
Figure 1.
Generation of CPPs in the blood is a distinctive feature of cerebrovascular disease and coronary artery disease. (A) Experimental pipeline assaying human serum propensity to produce CPPs. The assay includes addition of excessive CaCl2 and Na2HPO4 concentrations to the serum followed by 24 h incubation in cell culture conditions and measurement of the optical density at a wavelength of 650 nm (OD650), followed by background subtraction (OD650 of the serum sample without added CaCl2 and Na2HPO4). (B) Determination of the optimal amount of added CaCl2 and Na2HPO4 for the assay described in (A). Ascending equimolar concentrations (0.5, 1, 2, 3, 4, and 5 mmol/L) of CaCl2 and Na2HPO4 were added to the serum of healthy individuals (n = 49) followed by OD650 measurement and background subtraction. The 2 mmol/L of added CaCl2 and Na2HPO4 was a threshold above which all samples showed an OD650 > 0 after the background subtraction, which indicated CPP formation. (C) Temporal pattern of CPP formation in the setup from (A). Equimolar (2 mmol/L) concentrations of CaCl2 and Na2HPO4 were added to the serum of healthy individuals (n = 42) with the subsequent time-lapse measurement of OD650 to evaluate CPP formation over time. The average one-half maximal transition time (T50) reflects the average time required for reaching one-half of the maximal OD650 increase across the samples. The one-half maximal OD650 increase reflects the average OD650 value equal to half of the maximal OD650 increase across the samples. (D) Equimolar (2 mmol/L) concentrations of CaCl2 and Na2HPO4 were added to the serum of healthy individuals (n = 44) and patients with brain ischemia that required carotid endarterectomy (n = 44), ischemic stroke (n = 44), stable angina that required coronary artery bypass graft surgery (n = 44), or myocardial infarction (n = 44), followed by OD650 measurement and background subtraction. Note an increase in the CPP formation in the brain ischemia, ischemic stroke, and myocardial infarction groups. The tables to the right represent the odds ratios and p-values for the risk of cerebrovascular disease, coronary artery disease, or unstable plaque phenotype in percentiles with the highest and lowest OD650 increases. (E) Measurement of ionised calcium (Ca2+), total protein, and albumin levels in the serum of healthy individuals (n = 88) and patients with cerebrovascular disease (brain ischemia and ischemic stroke combined, n = 88) or coronary artery disease (stable angina and myocardial infarction combined, n = 88). The tables below represent the odds ratios and p-values for the risk of cerebrovascular disease or coronary artery disease in percentiles with the highest and lowest Ca2+, total protein, and albumin values. Each dot represents a serum sample collected from one subject. Whiskers indicate ranges, box bounds indicate the 25th–75th percentiles, centre lines indicate the median. p-values are provided above the boxes (statistically significant differences are marked by asterisks), Kruskal–Wallis test with post hoc false discovery rate correction by two-stage linear step-up procedure of Benjamini, Krieger, and Yekutieli. CPP—calciprotein particles, OD650—optical density at 650 nm wavelength.

