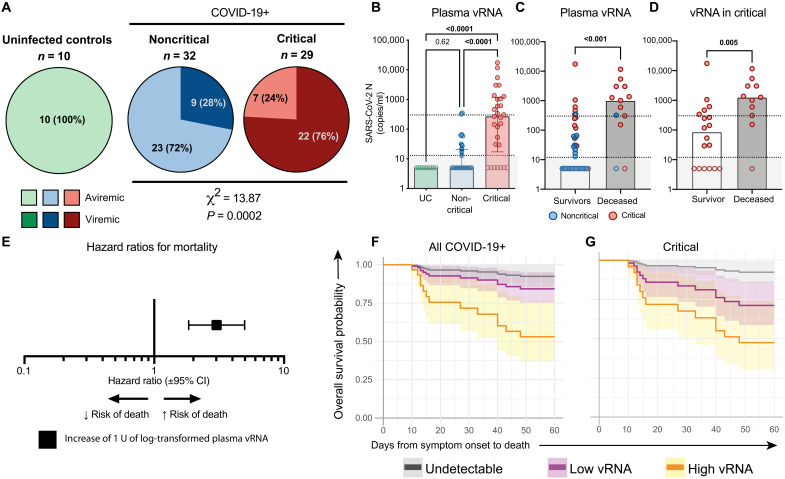
Fig. 1. High quantity of SARS-CoV-2 RNA in plasma at DSO11 is associated with increased risk of mortality.
(A) Pie charts representing the fractions of assessed samples that had undetectable (aviremic, light shades, <13 copies/ml) or detectable SARS-CoV-2 vRNA (dark shades, ≥13 copies/ml). Numbers in parts refer to the number (and percentages) of patients within each cohort. Noncritical and critical subgroups compared by χ2 test. (B) Quantities of SARS-CoV-2 N copies detected per milliliter of plasma in each cohort. Dotted line is the limit of detection (13 copies/ml). Empty shapes have undetectable vRNA (arbitrarily set at 5 copies/ml for representation). (C and D) Amounts of SARS-CoV-2 N copies detected per milliliter of plasma in patients who survived (white column) or died (gray column) by DSO60 for (C) total cohort or (D) critical subgroup only. Red circles represent critical patients, and blue circles are noncritical. (E) HR with 95% CI calculated using Cox regression for an increase of 1 U of log10-transformed vRNA (copies/ml). (F and G) Modelization of the predicted survival curves of patients with high [orange; upper interquartile range (IQR)], low (purple; lower IQR), or undetectable (gray) plasma vRNA in (F) all patients with COVID-19 or (G) critical cases only. (B) Kruskal-Wallis with Dunn’s multiple comparisons test. (C) Mann-Whitney test. n = 61 COVID-19 subjects (13 mortalities) or 29 critical COVID-19 cases (11 mortalities) and 10 UC. IQR: calculated among detectable vRNA quantities only.

