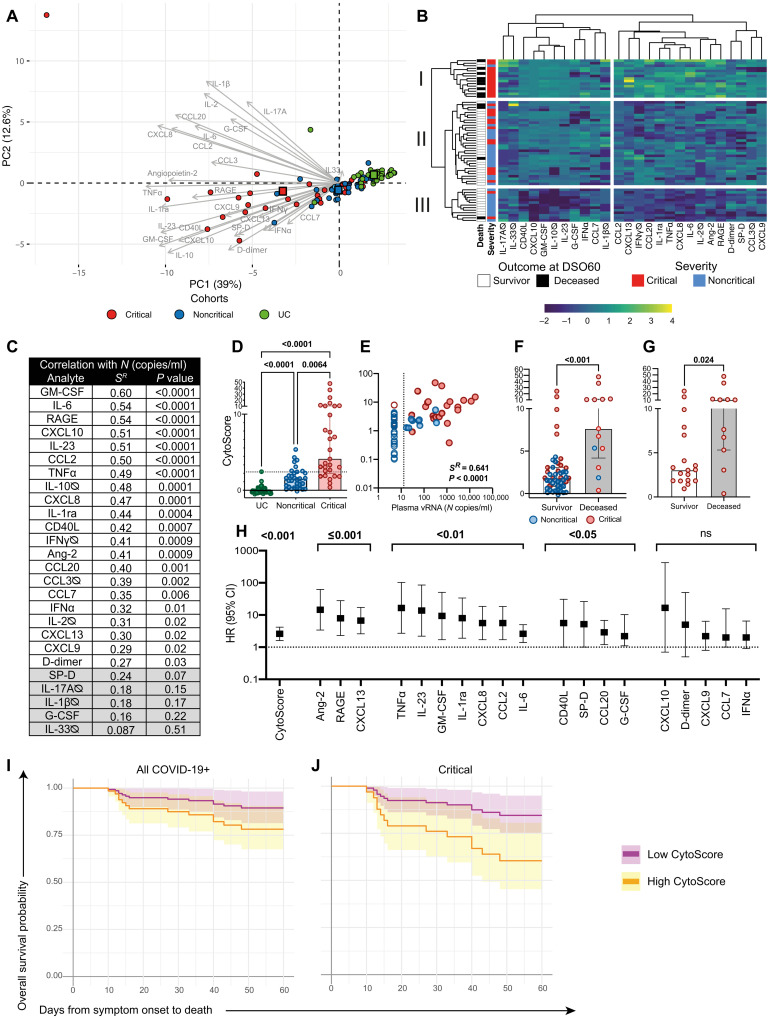
Fig. 2. High cytokine titers in plasma at DSO11 discriminates critical disease and is associated with increased risk of mortality.
(A) PCA representation of critical and noncritical patients (at DSO11), and UC (at baseline), on the basis of the 26 plasma analytes. Color-coded squares represent the mean PC (principal component) coordinates for each group. Length of arrow indicates the contribution of analytes to PCs. Numbers in parentheses along axes are the percentage of variance that PC accounts for. (B) Heatmap analysis of log-transformed concentrations of all 26 plasma analytes (yellow: high relative expression; blue: low relative expression), with unsupervised hierarchical clustering of the analytes (top dendrogram) or of patients (left dendrogram). The leftmost column represents outcome at DS60 (white: survival; black: deceased). The following column is the severity of the patient at DSO11. (C) Table showing the Spearman R values and corresponding P values of correlation of each plasma analyte with plasma vRNA. Values shaded in gray are nonsignificant. (D) Comparison of CytoScore of each cohort (see Materials and Methods for details on CytoScore). (E) Correlation between plasma vRNA and CytoScore. Empty shapes are aviremics (<13 copies of SARS-CoV-2 N copies/ml of plasma). (F and G) CytoScore of patients who survived (white column) or deceased (gray column) by DSO60 for (F) all patients with COVID-19 or (G) critical subgroup only. (H) HR with 95% CI calculated using Cox regression for a 1-U increase in the log10-transformed concentration of each plasma analyte with robust detection (see Materials and Methods for details) and CytoScore. ns: not significant. (I and J) Modelization of the predicted survival curves of patients with high (orange; upper IQR) or low (purple; lower IQR) CytoScore in (I) all patients with COVID-19 or (J) critical subgroup only. (C and E) Spearman correlations. (D) Kruskal-Wallis with Dunn’s multiple comparisons test. (F) Mann-Whitney test. For (A), (B), and (D) to (F), color-coded dots represent severity of the patient at DSO11 (red: critical; blue: noncritical) or UC cohort (green). (B and D) Cytokines with titles annotated by ∅ are poorly detected (see Materials and Methods for details). n = 61 COVID-19 subjects (13 mortalities) or 29 critical COVID-19 cases (11 mortalities) and 43 UC. IQR: calculated within the CytoScores of the COVID-19 discovery cohort.

