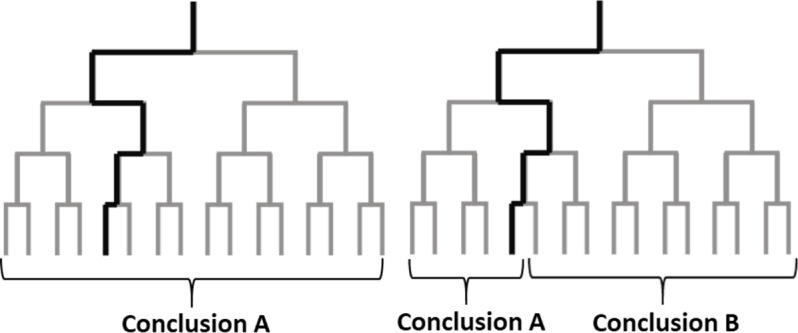
Figure 1. Analysis choices and alternative plausible paths.

The analysis of a large dataset can involve a sequence of analysis choices, as depicted in these schematic diagrams. The analyst first must decide between two options at the start of the analysis (top), and must make three additional decisions during the analysis: this leads to 16 possible paths for the analysis (grey lines). The left panel shows an example in which all possible paths lead to the same conclusion; the right panel shows an example in which some paths lead to conclusion A and other paths lead to conclusion B. Unless we can test alternative paths, we cannot know if the results obtained by following one particular path (thick black line) are robust, or if other plausible paths would lead to different results.
