. 2021 Nov 26;10:e71752. doi: 10.7554/eLife.71752

Figure 1. Diverse classes of human dorsal root ganglia (DRG) neurons revealed by single nuclear transcriptomics.

(A) Universal manifold (UMAP) representation of graph-based co-clustered snRNA sequences from human DRG nuclei reveal two well separated groups corresponding to sensory neurons (colored) and non-neuronal cells (gray). To the right, a dotplot highlights the expression of markers that help distinguish these groups of cells (see also Figure 1—figure supplement 2A for more information about preliminary analysis). (B) Reanalyzing 1837 neuronal nuclei clusters human DRG neurons into transcriptomically distinct groups that have been differentially colored. (C) Similarity in expression of differentially expressed genes between human and mouse neuronal types may help functional classification of neuronal types: UMAP representation of human DRG neurons showing relative expression level (blue) of diagnostic markers. For comparison UMAP representation of mouse neurons (Renthal et al., 2020) showing the relative expression patterns of the same markers. In combination, the expression patterns of these and other genes (Figure 1—figure supplements 2 and 4, Figure 1—figure supplement 5) were used to tentatively match several human and mouse transcriptomic classes (Figure 1—figure supplement 4).

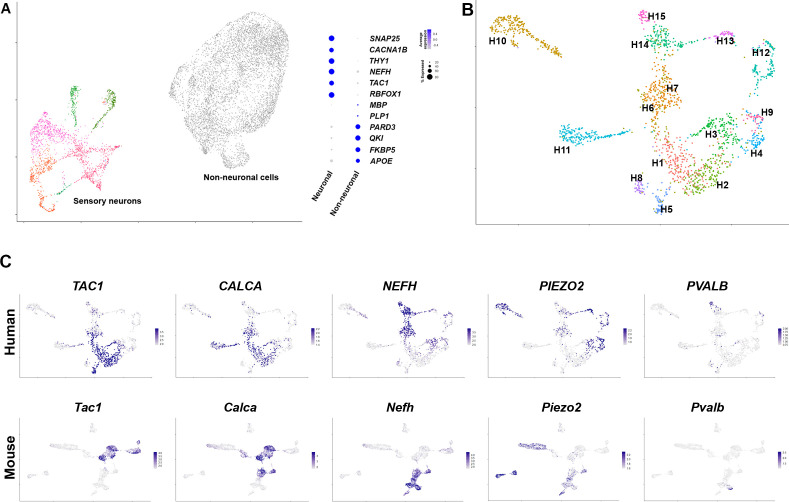
Figure 1.

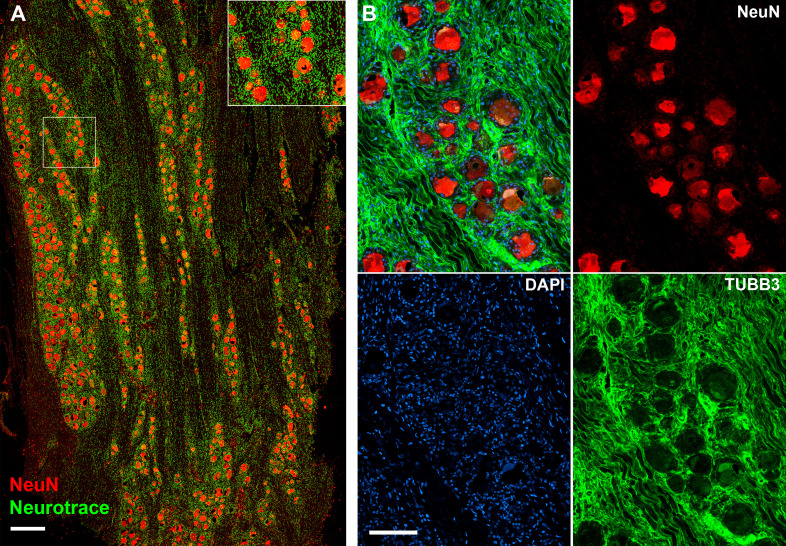
Figure 1—figure supplement 1. Human dorsal root ganglia (DRG) neurons express NeuN.

Figure 1—figure supplement 1.

(A) Confocal image showing section of a DRG ganglion stained using NeuN histochemistry (red) and neurotrace (green). Note that the large diameter neurons are strongly NeuN positive whereas neurotrace also detects non-neuronal structures (scale bar = 0.5 mm). Inset shows magnified view of the boxed region. (B) Immunohistochemistry (IHC) double staining using anti NeuN (red) anti-β3 tubulin (TUBB3, green) further demonstrates NeuN staining of both small and large diameter DRG soma; the tubulin staining primarily highlights neuronal processes rich in microtubules. Also shown is 4′,6-diamidino-2-phenylindole (DAPI) staining emphasizing the need to enrich for neuronal nuclei prior to sequencing since the number of non-neuronal nuclei greatly exceeds those of neurons (scale bar = 100 µm).
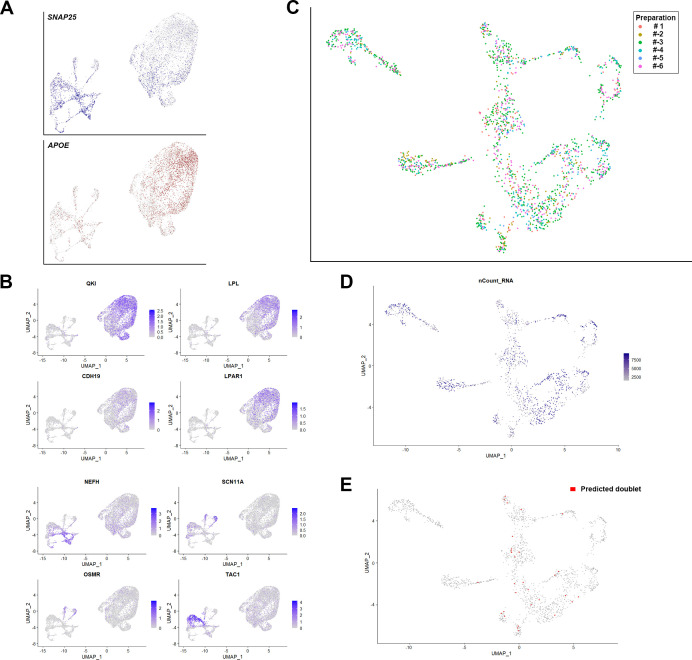
Figure 1—figure supplement 2. Support for the clustering of human dorsal root ganglia (DRG) neurons.

Figure 1—figure supplement 2.

(A) Universal manifold (UMAP) representation showing relative expression levels of the neuronal marker SNAP25 (blue) and the non-neuronal gene APOE (red) in the initial clustering of sn-RNA sequencing data. It should be noted that the majority of the non-neuronal cells came from a single nuclear isolation where it is likely that neuronal nuclear purification was not effective. Sequence analysis indicated that most of the non-neuronal cells were satellite microglia although other cell types were also seen. (B) UMAP representation showing other markers that help distinguish non-neuronal nuclei from DRG neurons. (C) UMAP representation of the clustering of human DRG neurons highlighting the contributions of the six different preparations to the dataset. Note that clusters were populated with data from multiple different preparations. (D) UMAP representation of the number of genes identified per DRG neuron. (E) UMAP representation of 30 doublets predicted using DoubletFinder (see Methods).
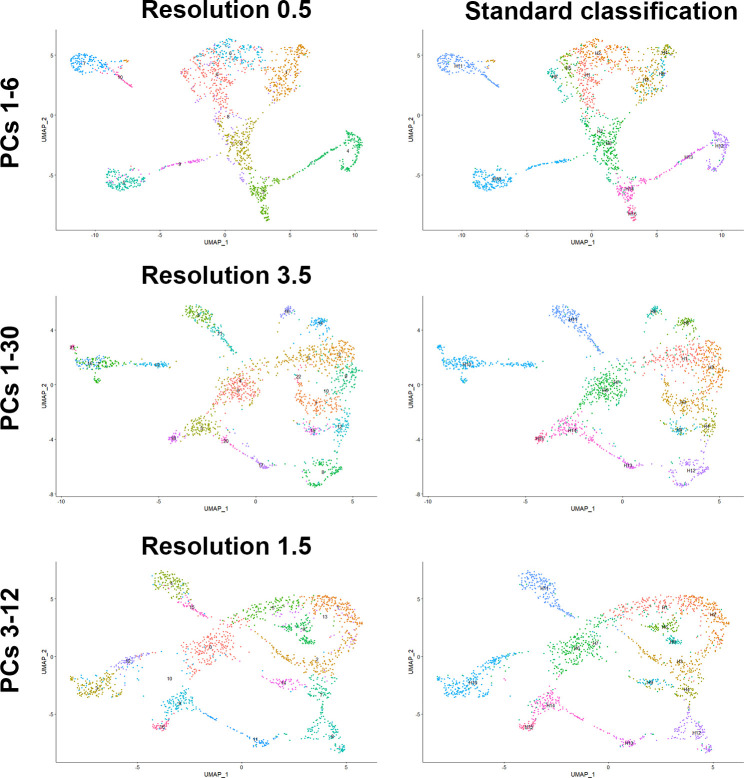
Figure 1—figure supplement 3. Robust clustering of human dorsal root ganglia (DRG) neurons.

Figure 1—figure supplement 3.

Universal manifold (UMAP) representations showing analysis of human DRG neurons using different parameters in Seurat. The choice of principal components (PCs) used for UMAP display and clustering is indicated to the left and for the left column the resolution of the clustering is shown above the UMAP. Note that the number of clusters detected varies with the resolution chosen. The right column shows the same UMAP as the left column but now the original identity of neurons from Figure 1 has been mapped onto the clustering. Note that the 15 clusters map to relatively contiguous populations of neurons over a wide range of PC choices indicating that there are very robust transcriptomic differences between about a dozen different classes of DRG neurons in our dataset.
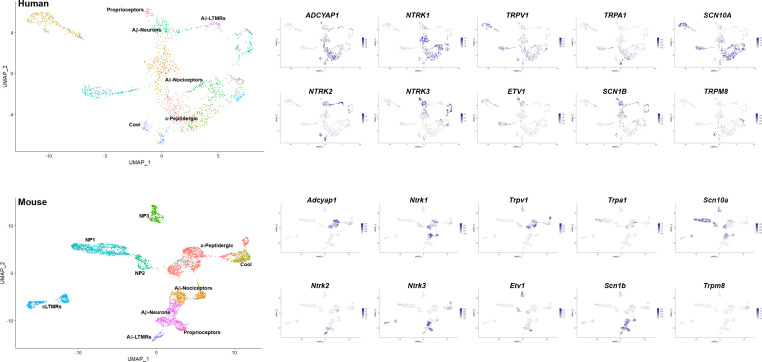
Figure 1—figure supplement 4. Additional markers that support similarities between dorsal root ganglia (DRG) neuronal clusters across species.

Figure 1—figure supplement 4.

Universal manifold (UMAP) representations: upper panels, human sn-RNA sequencing; lower panels, mouse sn-RNA sequencing. To the left, identity of the different neuronal types is differentially colored. For the mouse, the identities of all clusters are indicated, for the human data, the position of names indicate the clusters with shared markers indicating a match to mouse neuronal types. The expression pattern of several such marker genes (blue) is shown to the right (see also Figure 1 and Figure 1—figure supplement 5). In the human dataset, Aδ nociceptors account for 26% of sequenced neurons; c-peptidergic nociceptors, 23% (including H5, 4%); Aβ neurons, 7%; proprioceptors, 2%; Aδ-LTMRs, 3%; and cool sensors, 3% (totaling 64% of all neurons). Other classes not identified as potential counterparts to mouse neurons based on preliminary analysis of marker expression were H4, 4%; H9, 2%; H10, 13%; H11, 10%; and H12, 7%.
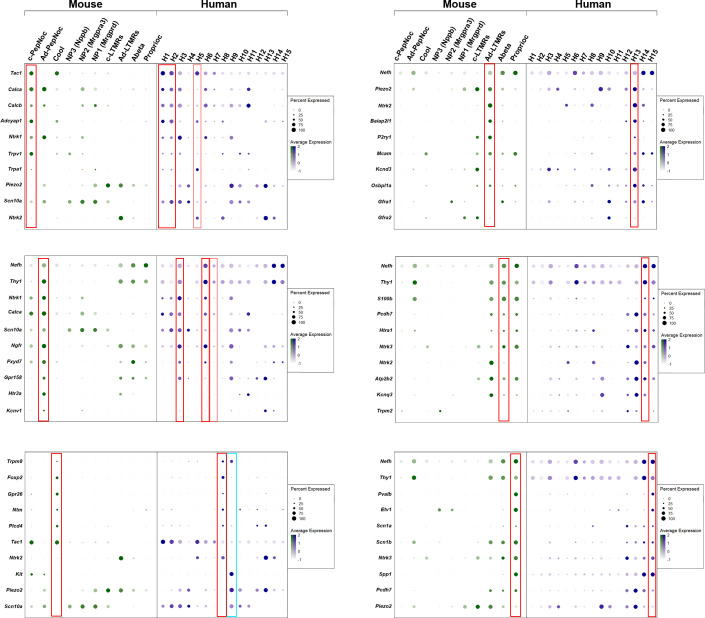
Figure 1—figure supplement 5. Dotplots of gene expression supporting similarity of several dorsal root ganglia (DRG) neuronal classes in mice and humans.

Figure 1—figure supplement 5.

Dotplots displaying information about the fractional expression and relative expression level of marker genes in the different identity classes of mouse (left, gray-green scale) and human (right, gray-blue scale). Marker genes were chosen based on their expression (or lack of expression) in particular classes of mouse neurons. Red boxes highlight the relationship between a particular mouse class and human neurons; fainter red boxes indicate human classes that share some characteristics with the highlighted mouse neurons. Left panel top to bottom: c-peptidergic nociceptors (c-PepNoc); Aδ-peptidergic nociceptors (Ad-PepNoc); cool sensing cells (Cool). Right panel top to bottom: AδLTMRs (Ad-LTMRs); Aβ neurons (Abeta); proprioceptors (Proprioc). The cyan box highlights H9 a human-specific cell type that expresses TRPM8 but also nociceptor markers and the mechanosensitive channel PIEZO2 unlike the putative cool sensing cells in human (H8) and in mice.