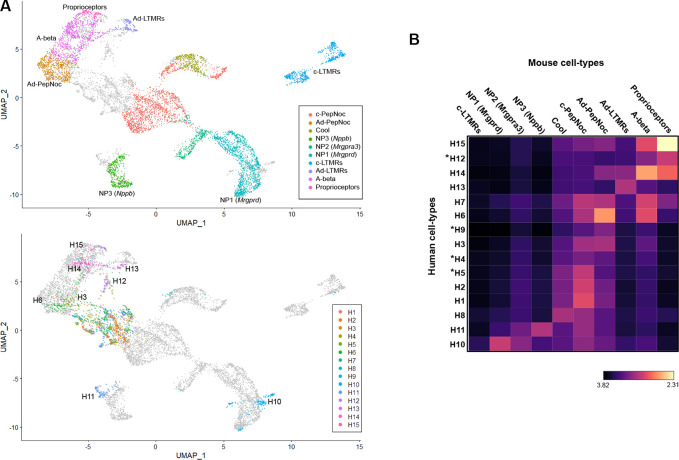
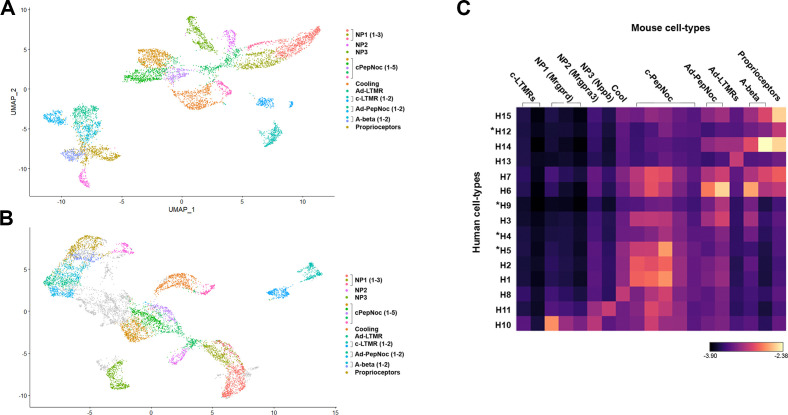
Figure 3. Co-clustering of human and mouse neurons support tentative assignments based on select genes.
(A) Universal manifold (UMAP) representation of the co-clustering of mouse and human neurons. Upper panel shows the mouse neurons colored by their identity when analyzed alone (Figure 1—figure supplement 1); lower panel shows human neurons colored by their identity when analyzed alone (Figure 1). Note that large diameter human neurons match their expected mouse counterparts reasonably well and that the two classes of neurons expressing itch-related transcripts H10 and H11 best match NP1 and NP3 neurons, respectively. (B) Heatmap showing the natural logarithm (see scale bar) of Kullback–Leibler divergences for the various human neuron classes when compared to each class of mouse cells as a reference distribution; potentially human-specific classes based on functional markers are marked by *; see also Figure 3—figure supplement 1.


