. 2021 Nov 26;10:e71752. doi: 10.7554/eLife.71752

Figure 4. Transcriptomically related classes of human dorsal root ganglia (DRG) neurons are spatially clustered in the ganglion.

Confocal images of sections through a human DRG probed for expression of key markers using multiplexed in situ hybridization (ISH); see Figure 4—figure supplement 1 for the individual panels and additional probes. (A) Left panel shows a group of four H8-neurons (yellow arrows) that express TRPM8 (green) but not PIEZO2 (red) or SCN10A (blue). By contrast, right panel shows a different region of the ganglion where three H9-neurons coexpress these three transcripts (double arrowheads). (B) Other regions of the ganglia were dominated by larger diameter neurons. Putative proprioceptors, highlighted by double arrowheads, expressing PIEZO2 (green) and PVALB (red), but not NTRK2 (blue) were typically highly clustered in the ganglion. (C) Lower magnification images of complete sections stained for NEFH (green) and SCN10A (red) highlight the extensive co-clustering of large and small diameter neurons in different individuals. Scale bars = 100 µm in (A and B); 500 µm in (C). (D) The nearest n neighbors of NEFH and SCN10A single positive neurons in (C) were identified (for n = 1–40): green lines represent proportion (mean, solid line ± standard error of mean [SEM], shaded) of cells surrounding NEFH-positive neurons; red lines, proportion (mean, solid line ± SEM, shaded) of cells surrounding SCN10A-positive neurons. Left panel: proportion of surrounding cells that were NEFH positive. Right panel: proportion of surrounding cells that were SCN10A positive. Dashed black lines are the proportions expected for randomly distributed cells. Insets schematically show a central cell (highlighted by a star) and the surrounding neurons. Neighboring NEFH-positive cells are colored green and SCN10A-positive cells are colored red when these are being scored in the associated graph; gray cells are positive for the other marker. Clustering was statistically significant across the complete range (1–40 neighbors), p ≤ 6.96 × 10−42 (one-tailed Mann–Whitney U-test); n = 803 single positive cells confirming both short and long-range grouping of similar classes of human DRG neurons.

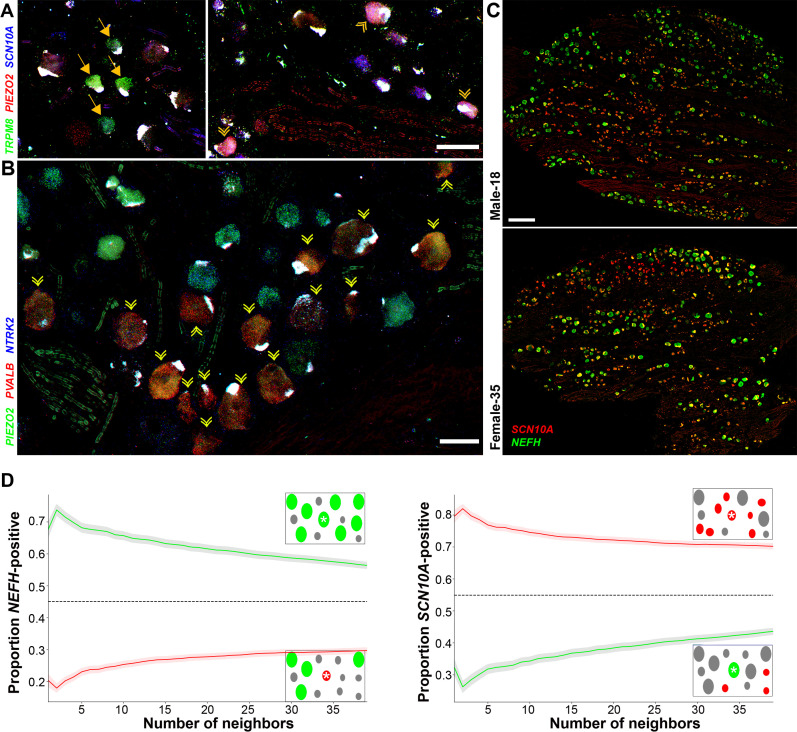
Figure 4.

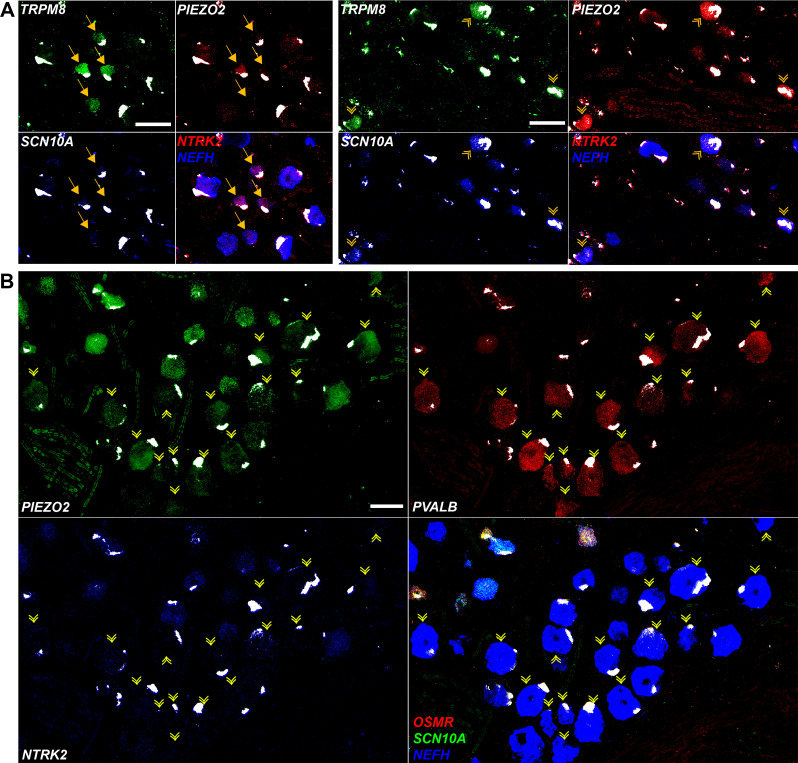
Figure 4—figure supplement 1. Expression profiles of clusters of H8 (cool), H9 (human-specific), and H15 (proprioceptive) neurons.

Figure 4—figure supplement 1.

Individual channels for the in situ hybridization (ISH) images in Figure 4 are shown to highlight the expression patterns described in the text. Strong autofluorescence signals that are present in all channels have been masked in white. Additional combinations of gene expression data in these regions of the ganglion are shown to identify neurons and reveal extra transcriptomic information. (A) Spatial clusters containing H8 putative cool sensing neurons (left) and H9 cool/mechanosensory nociceptors (right) are shown and identified as in Figure 4A. H8 neurons are generally NTRK2 positive but are only weakly positive for NEFH. By contrast, H9 cells are NEFH positive but do not express significant NTRK2, in keeping with transcriptomic data. Note that clusters of these neurons segregate in distinct fields of the ganglion. (B) H15 (presumptive proprioceptors) form a subcluster of NEFH-positive cells that are essentially devoid of nociceptors (marked by SCN10A) including nonpeptidergic neurons expressing OSMR. Many of the PVALB-negative large diameter neurons in this region of the ganglion were NTRK2 positive; by contrast this gene was not detectable in H15 cells in keeping with the transcriptomic data. Scale bars = 100 µm; arrows and arrowheads are as in Figure 4.
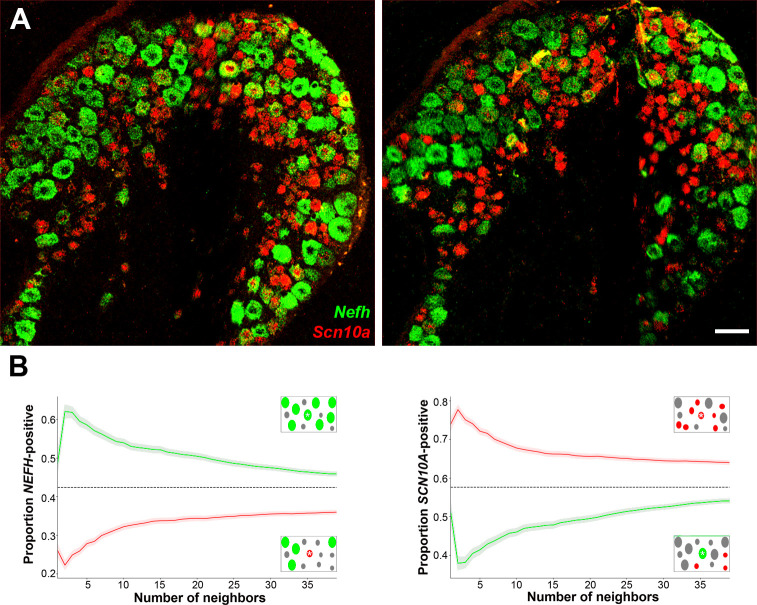
Figure 4—figure supplement 2. Expression profiles of clusters of H8 (cool), H9 (human-specific), and H15 (proprioceptive) neurons.

Figure 4—figure supplement 2.

(A) Confocal images of mouse lumbar dorsal root ganglia (DRG) in situ hybridization (ISH) showing Nefh (green) and Scn10a (red); scale bars = 100 µm. (B) The nearest n neighbors of Nefh and Scn10a single positive neurons were identified (for n = 1–40): green lines represent proportion (mean, solid line ± standard error of mean [SEM], shaded) of cells surrounding Nefh-positive neurons; red lines, proportion (mean, solid line ± SEM, shaded) of cells surrounding Scn10a-positive neurons. Left panel: proportion of surrounding cells that were Nefh positive. Right panel: proportion of surrounding cells that were Scn10a positive. Dashed black lines are the proportions expected for randomly distributed cells. Insets schematically show a central cell (highlighted by a star) and the surrounding neurons. Neighboring Nefh-positive cells are colored green and Scn10a-positive cells are colored red when these are being scored in the associated graph; gray cells are positive for the other marker. Clustering was statistically significant across the complete range (1–40 neighbors), p ≤ 3.98 × 10⁻¹⁵ (one-tailed Mann–Whitney U-test); n = 1117 single positive cells confirming both short- and long-range grouping of similar classes of mouse DRG neurons.