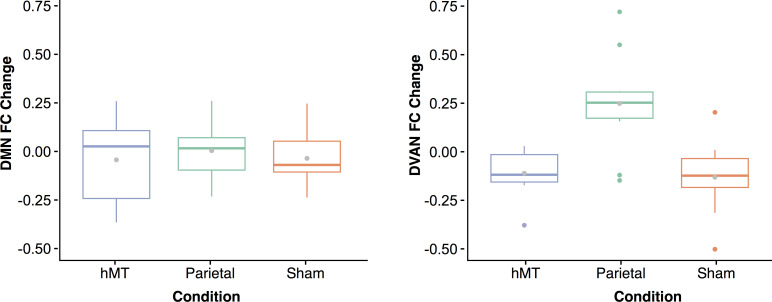
Figure 6. Functional connectivity (FC) changes between pre- and post-stimulation.
Box plots for overall change in functional connectivity (calculated as the difference in connectivity between the post- and the pre-stimulation session) for the default mode network (A) and the dorsal ventral attention network (B) depicted per stimulation condition (Parietal, hMT+, and Sham). Gray dots within each box represent the mean change in FC per condition.

