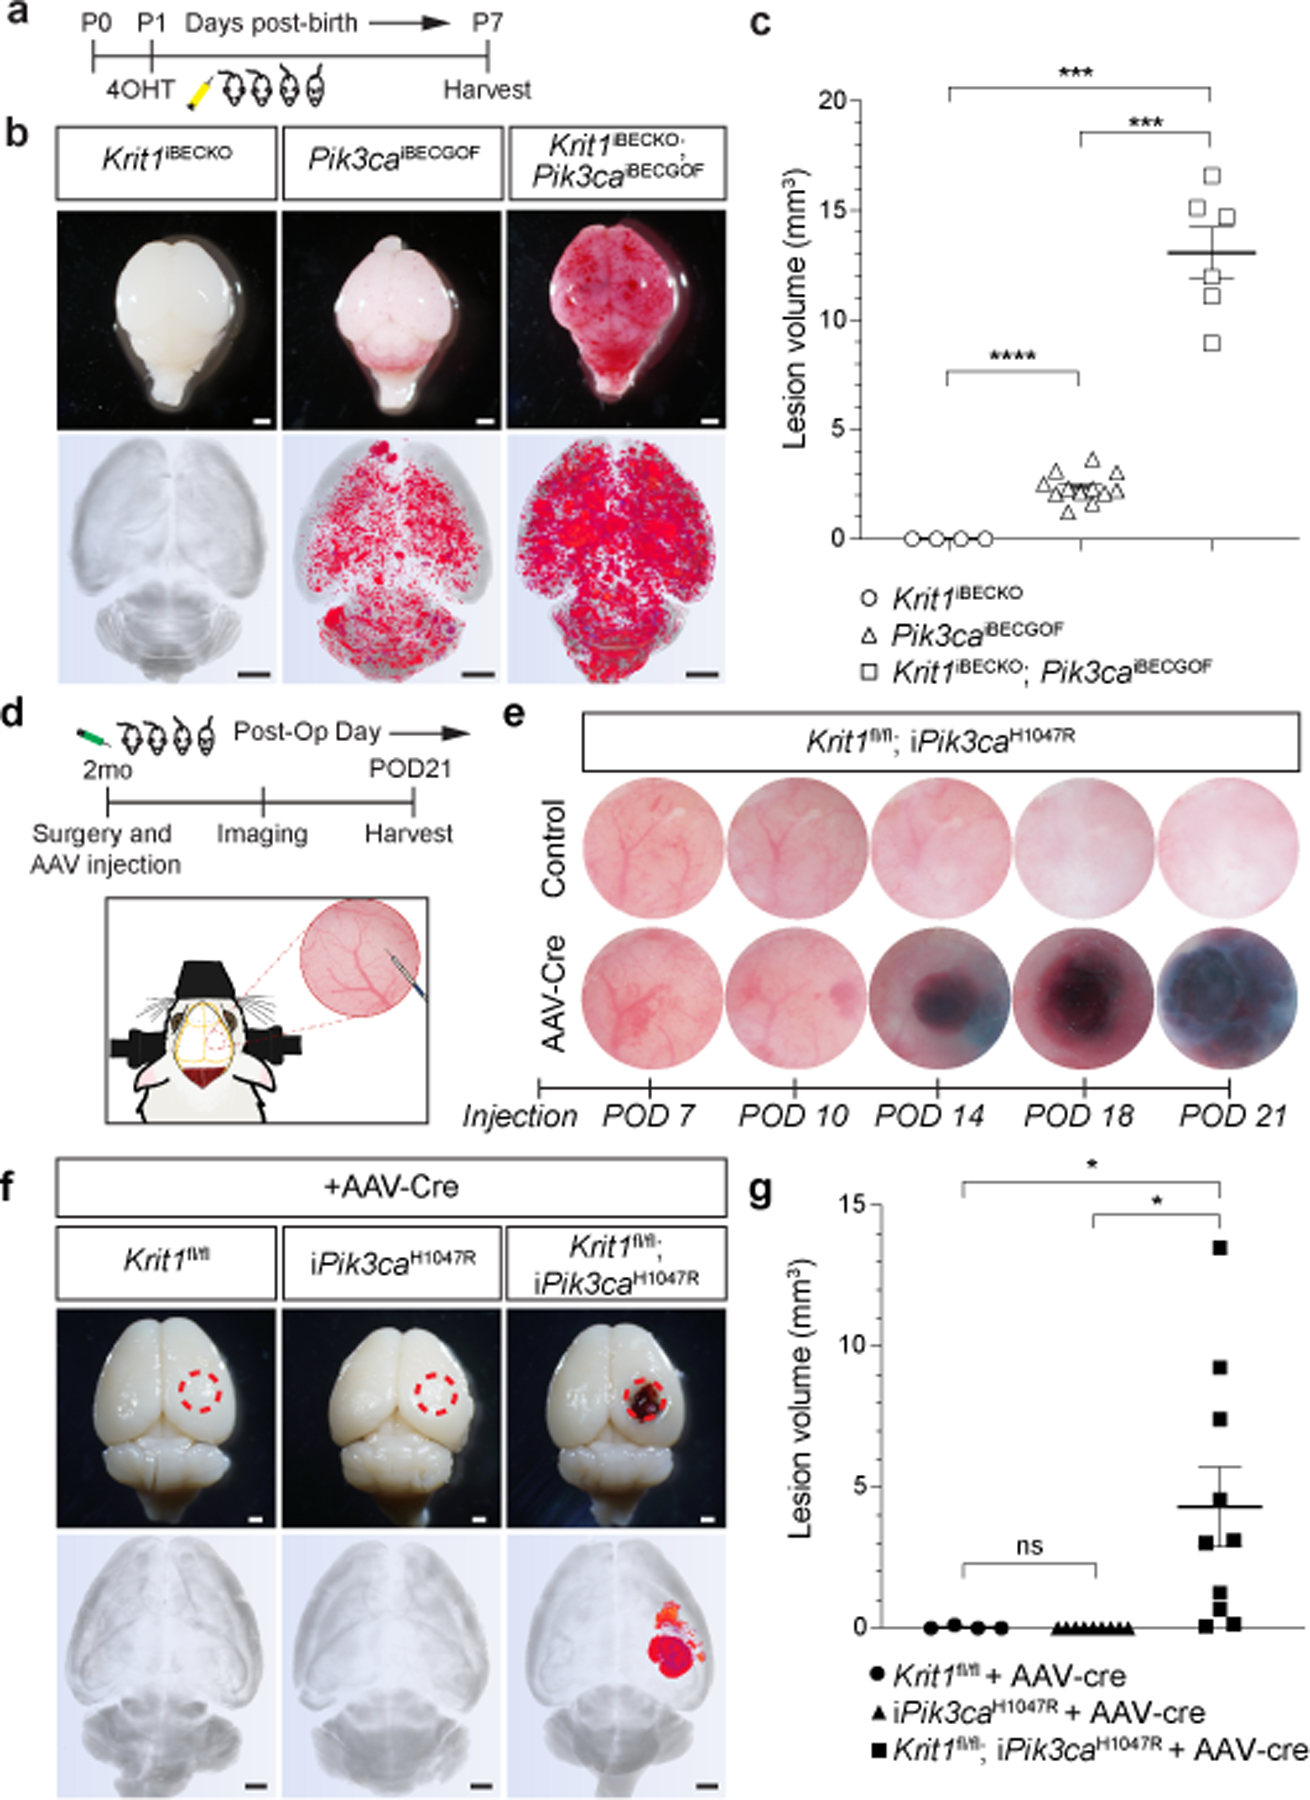
Figure 1. CCM LOF and PIK3CA GOF synergize during cavernous malformation in the neonatal brain and are both required for malformations in the adult brain.

a, Schematic of neonatal induction of Krit1 deletion and/or PIK3CAH1047R expression. 4-hydroxytamoxifen (4OHT) injection at P1 was used to inducibly delete Krit1 (Krit1iBECKO), drive expression of PIK3CAH1047R (Pik3caiBECGOF) or both specifically in the brain endothelial cells of mice carrying a resistant gut microbiome. b, Representative visual and microCT images of the indicated P7 brains. Note that loss of KRIT1 alone is not sufficient for CCM formation in animals with a resistant microbiome. Scale bars, 1mm. c, MicroCT quantitation of lesion volumes at P7. (Krit1iBECKO, n=4; Pik3caiBECGOF, n=12; Krit1iBECKO;Pik3caiBECGOF , n=6). Indicated p-values are: p=0.0002; p=0.0001; p=8e−8 (top to bottom). d, Schematic and diagram of the experimental approach in which a cranial window is created and AAV virus injected into the brains of 2 month old mice with serial imaging on indicated post-operative days (POD). e, Serial images obtained through the same cranial window of Krit1fl/fl;iPik3caH1047R animals following injection of control or Cre-expressing AAV vectors. Cranial window images representative of 4 animals/group. f, Representative visual and microCT images of brains harvested 21 days after injection of AAV-Cre into adult animals with the indicated genotypes. iPik3caH1047R designation includes iPik3caH1047R and/or Krit1fl/+;iPik3caH1047R genotypes. Dotted circles indicate the site of cranial window and AAV-Cre injection. Scale bars, 1mm. g, MicroCT quantitation of lesion volumes 21 days after injection of AAV-Cre. (Krit1fl/fl, n=4; iPik3caH1047R, n=9; Krit1fl/fl;iPik3caH1047R, n=10). Indicated p-values are: p=0.0144; p=0.0140; p=0.4174 (top to bottom). Data are mean ± s.e.m. Unpaired, two-tailed Welch’s t-test. ns indicates p not significant, p>0.05; *indicates p<0.05; ***indicates p<0.001; ****indicates p<0.0001.
