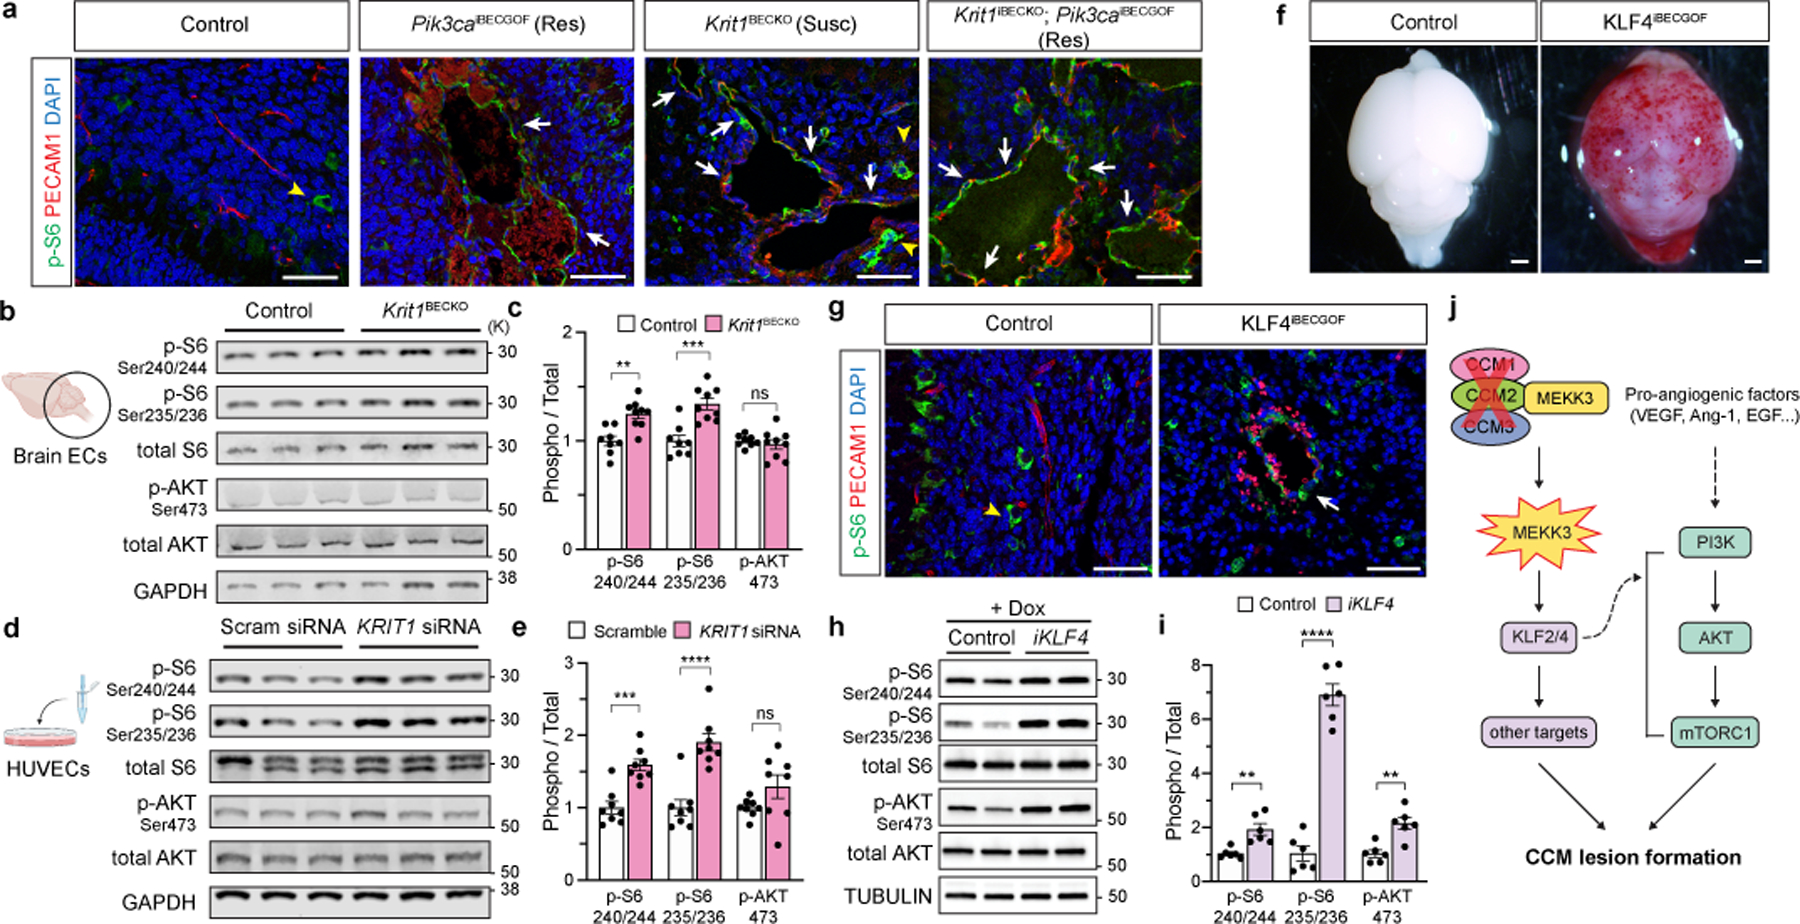
Figure 3. Endothelial CCM LOF augments PI3K-mTORC1 signaling through KLF4.

a, Immunostaining for phospho-S6 ribosomal protein (p-S6) and endothelial cell (EC) marker PECAM1 in P6 hindbrain sections with a resistant (Res) or susceptible (Susc) microbiome. White arrows indicate p-S6 positive ECs, yellow arrowheads indicate non-endothelial p-S6 positive cells in a and g. Scale bars, 50 microns. b, Immunoblot detection of phospho-AKT (p-AKT) and p-S6 in ECs from the hindbrains of P6 control and Krit1BECKO littermates. GAPDH loading control. c, Quantitation of immunoblotting for p-AKT and p-S6 relative to total AKT and S6 protein. (n=8 hindbrains/group) Indicated p-values are: p=0.0010; p=0.0003; p=0.5205 (left to right). d, Immunoblot detection of p-AKT and p-S6 in cultured HUVECs treated with scrambled or KRIT1 siRNAs. e, Quantitation of immunoblotting for p-AKT and p-S6 relative to total AKT and S6 protein. (n=8 individual wells/group over 4 independent experiments). Indicated p-values are: p=0.0002; p=7e−6; p=0.1208 (left to right). f, Visual images of P6 control and KLF4iBECGOF littermates. Images representative of 8 animals/group. Scale bars, 1mm. g, Immunostaining for p-S6 and PECAM1 in hindbrain sections from P6 control and KLF4iBECGOF littermates. Scale bars, 50 microns. h, Immunoblot detection of p-AKT and p-S6 in HUVECs with expression of KLF4-GFP (“iKLF4” cells) or control lentivirus. Tubulin loading control. i, Quantitation of immunoblotting for p-AKT and p-S6 relative to total AKT and S6 in control and iKLF4 HUVECs. (n=6 individual wells/group over 3 independent experiments). p=0.0067; p=9e−7; p=0.0022 (left to right). j, Pathway schematic of how gain of CCM-MEKK3-KLF2/4 signaling is proposed to augment PI3K-mTORC1 signaling to drive CCM formation. Immunofluorescence in a and g representative of 10 tissue sections from n=4 individual animals/genotype. Data are mean ± s.e.m. Unpaired, two-tailed Welch’s t-test. ns indicates p not significant, p>0.05; **indicates p<0.01; ***indicates p<0.001; ****indicates p<0.0001. For gel source data, see Supplementary Figure 1.
