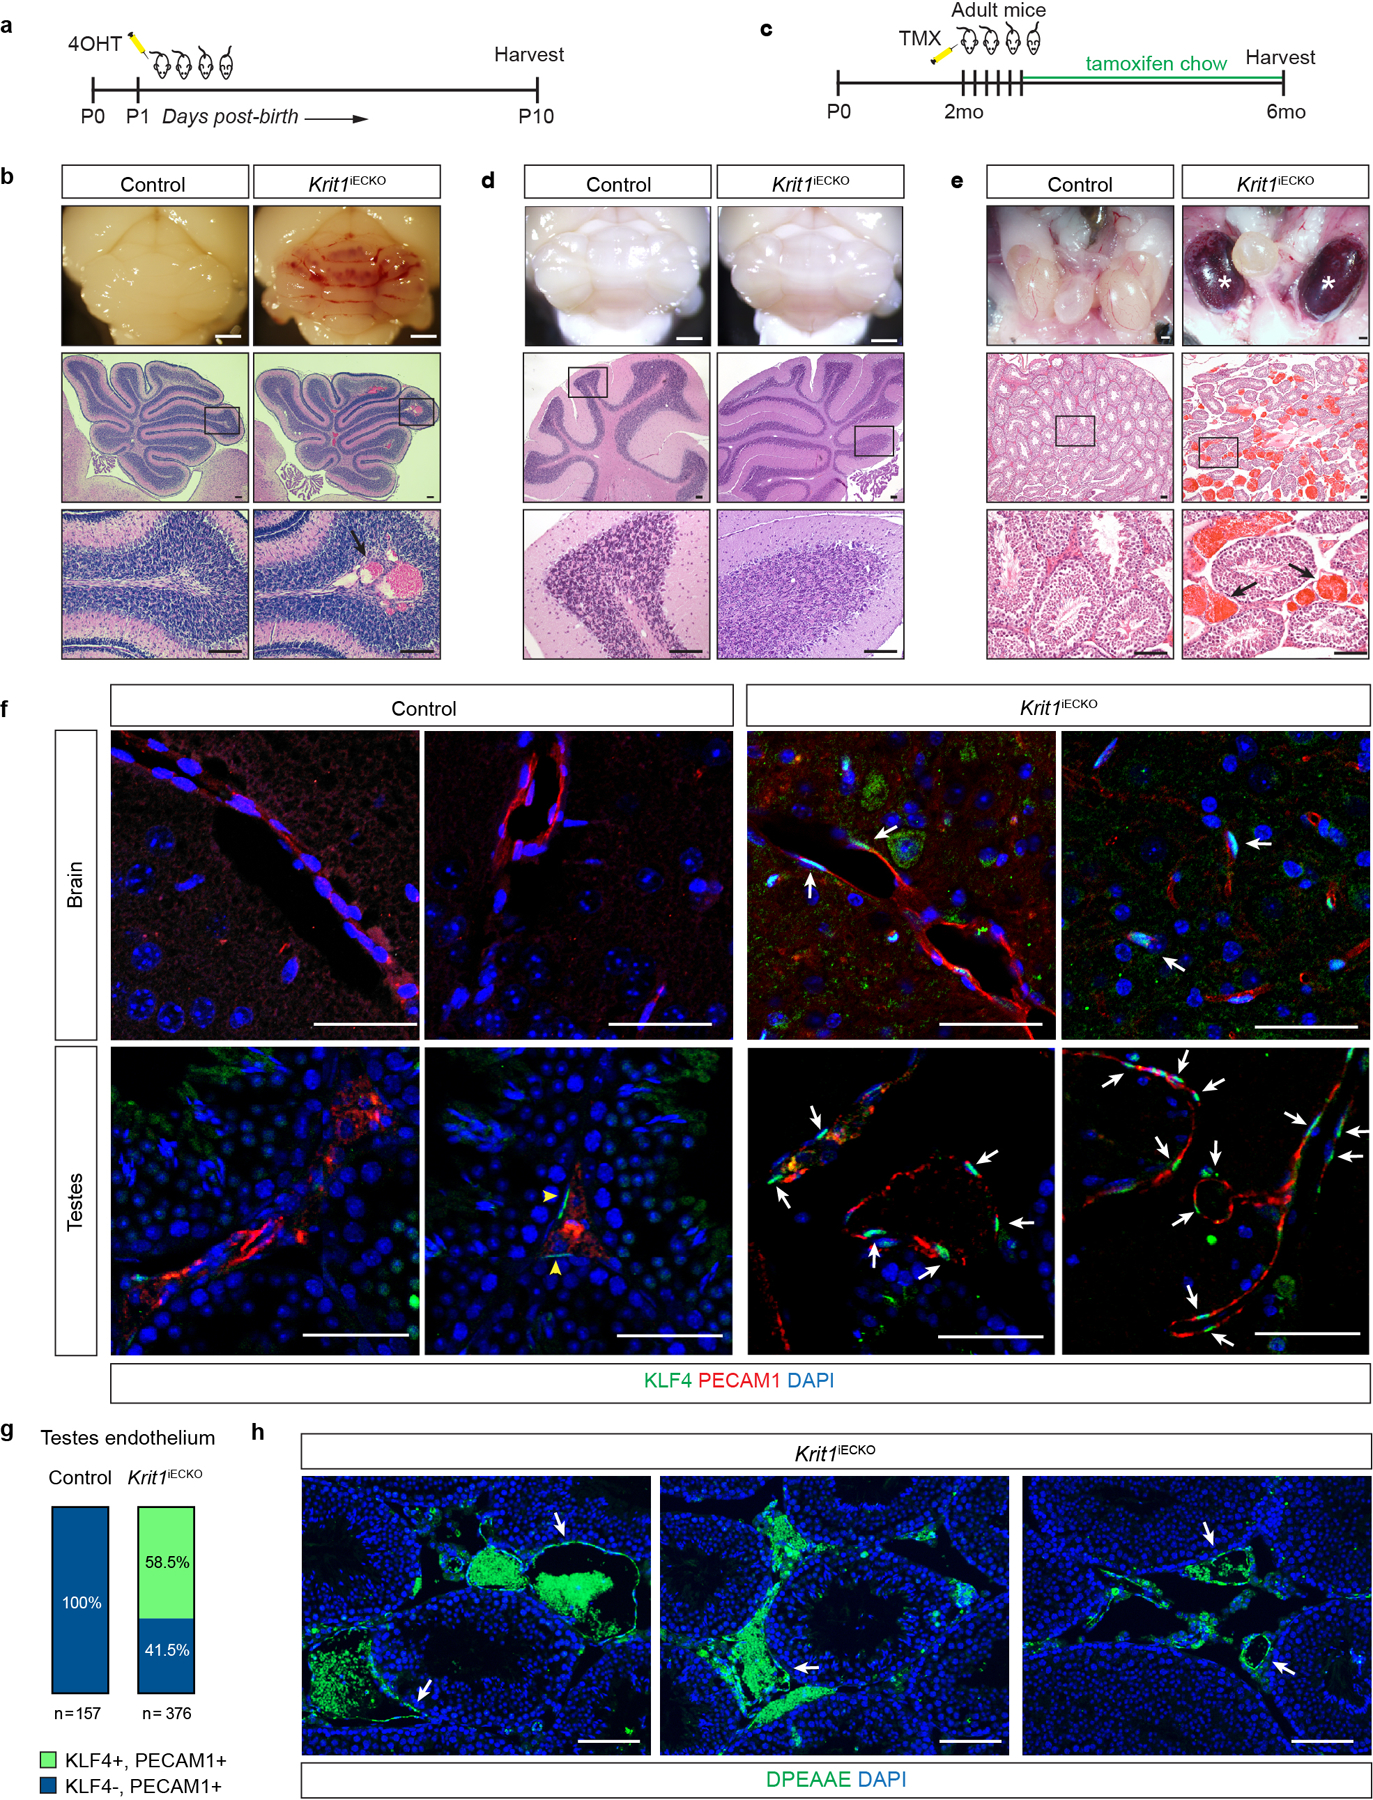
Extended Data Figure 1. Endothelial loss of CCM function in adult mice confers cavernous vascular malformations in the testis but not the brain.

a, Schematic of the neonatal endothelial CCM deletion experiment. b, Cavernous malformations form by P10 in the hindbrain of Krit1iECKO animals with a susceptible gut microbiome. Images of hindbrains from the indicated animals are shown above, and Hematoxylin-Eosin (H-E) stained histologic sections shown below. Arrow indicates a CCM lesion in the white matter venous vessel. c, Schematic of CCM gene deletion in endothelial cells (ECs) of adult mice on a susceptible microbiome background. d, Cavernous malformations are not detected in the brain of 6 month old Krit1iECKO animals following tamoxifen administration. Images of hindbrains from the indicated animals are shown above, and H-E stained histologic sections shown below. e, Cavernous malformations are detected in the testis of 6 month old Krit1iECKO animals. Images of testis from the indicated animals are shown above and H-E stained histologic sections shown below. * indicate blood-filled testes. Arrows indicate cavernous blood-filled vessels around the seminiferous tubules. For panels b, d, e: Visual images representative of n=4 animals/genotype; H-E histology representative of 6 tissue sections from n=4 animals. Scale bars for visual images, 1mm; scale bars for histology, 0.1mm. f, Immunostaining for KLF4 and endothelial cell marker PECAM1 in brain (top) and testis (bottom) from the experiment in c is shown. Note endothelial CCM LOF in adult mice results in KLF4 upregulation without CCM formation in the brain. Arrows indicate KLF4+ nuclei in PECAM1+ ECs. Yellow arrowheads indicate KLF4+ peritubular myoid cells. Scale bars, 50 microns. g, Quantitation of KLF4+ and KLF4- ECs identified using co-staining for KLF4 and PECAM1 in testis is shown. Quantitation from 10 individual 800micron x 800micron HPF from 3 individual animals. h, Immunostaining for DPEAAE, a versican neo-epitope exposed by ADAMTS-mediated proteolysis, is shown for Krit1iECKO testis. Arrows indicate peri-endothelial cell detection of DPEAAE around testicular cavernomas. Scale bars, 0.1mm. “Control” genotype in panels b, d, e, f, g indicate animals with genotypes of either Cdh5-CreERT2; Krit1fl/+ or Krit1fl/fl. Immunofluorescence images in f & h representative of 6 tissue sections from n=4 individual animals/genotype.
