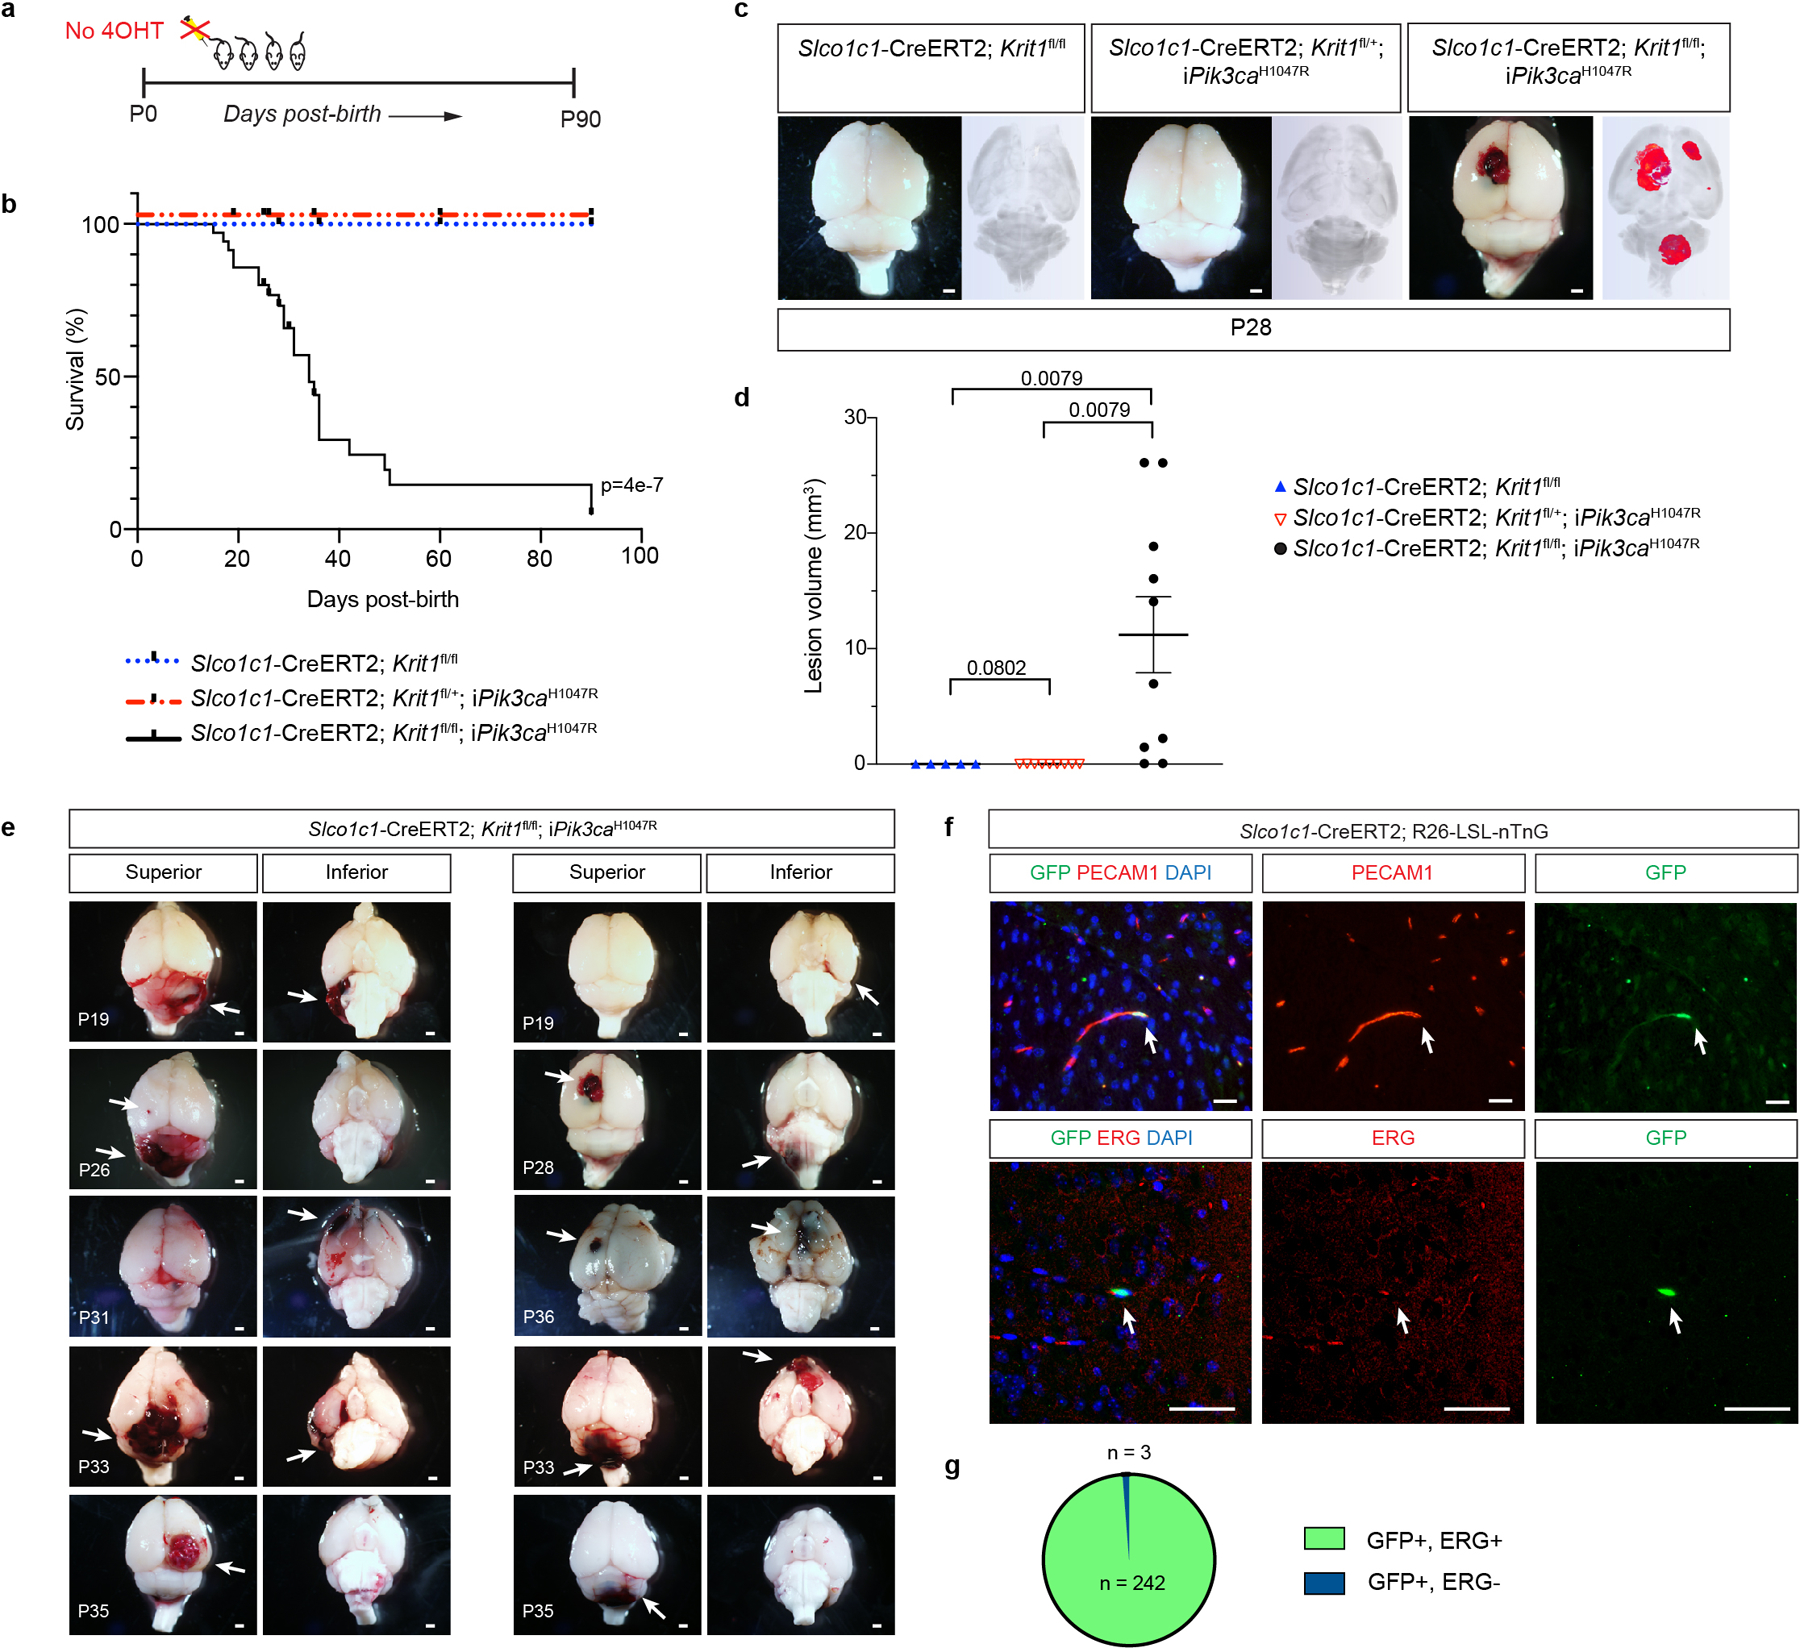
Extended Data Figure 4. Uninduced Slco1c1-CreERT2; Krit1fl/fl; iPik3caH1047R animals develop focal lesions due to Slco1c1-CreERT2 transgene endothelial leak.

a, Schematic for generation of a survival curve in the absence of tamoxifen administration. b, Postnatal survival curve in the absence of tamoxifen administration is shown for indicated genotypes. (Slco1c1-CreERT2;Krit1fl/fl, n=15, Slco1c1-CreERT2;Krit1fl/+;iPik3caH1047R n=10, Slco1c1-CreERT2;Krit1fl/fl;iPik3caH1047R n=39). Log-rank test. c, Representative visual and paired microCT images of brains harvested from untreated P28 littermates. Scale bars, 1mm. d, MicroCT quantitation of lesion volumes of untreated P28 animals. (Slco1c1-CreERT2;Krit1fl/fl, n=5, Slco1c1-CreERT2;Krit1fl/+;iPik3caH1047R n=9, Slco1c1-CreERT2;Krit1fl/fl;iPik3caH1047R n=10). Data are mean ± s.e.m. Unpaired, two-tailed Welch’s t-test. e, Additional visual images of brains from a superior and inferior perspective from animals harvested at various timepoints (P19-P36). Arrows point to focal vascular lesions. Scale bars, 1mm. f, Leak assessed by immunostaining of brain sections with antibodies against GFP to identify Cre-expressing cells, and cell surface marker PECAM1 (top) and nuclear protein ERG (bottom) to identify endothelial cells is shown. Scale bars, 50 microns. Immunofluorescence images representative of 10 tissue sections from n=4 individual animals/genotype. g, Quantitation of GFP+; ERG+ nuclei (n = 242) and GFP+; ERG- nuclei (n = 3) from 20 individual 800micron x 800micron HPF.
