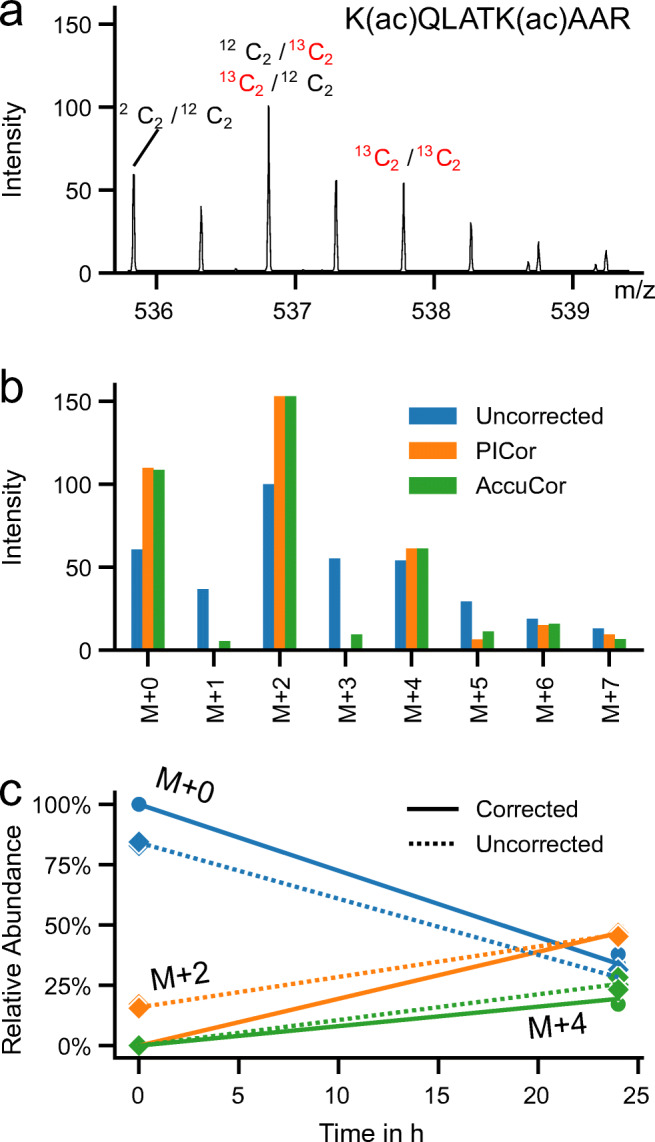
Fig. 2.

Metabolic labelling of fully acetylated histone 3 peptide H3(18-26) using 13C-glucose: a Example spectrum of time point 24 h. b Comparison of uncorrected peak height from the spectrum shown in a and corresponding values corrected with PICor and AccuCor. c Comparison of uncorrected and PICor corrected time course data. There are three different possible labelling states of the fully acetylated peptide. As either none (M + 0), one (M + 2) or both (M + 4) acetyl-groups at the two lysine residues (K18 and K23) in the H3(18-26) peptide can be labelled with 13C. Solid line — isotope corrected data; dashed line — uncorrected data; round dots — data point after correction; diamond dots — data point before correction. Individual data points, largely overlapping one another, from 3 biological replicates are shown
