Fig. 4.
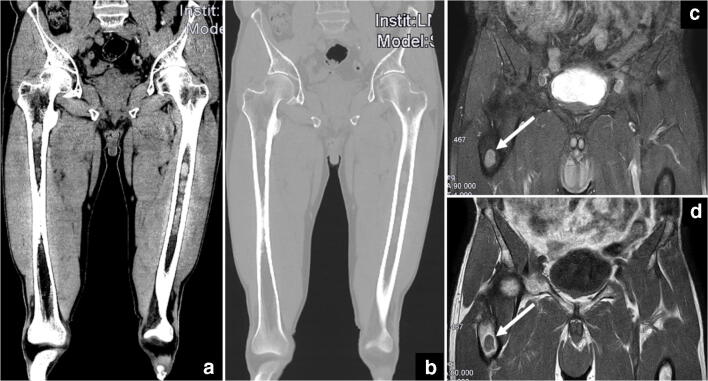
Illustration of typical marrow infiltrates in both femurs. (a) Coronal CT reformation in the soft-tissue window setting shows focal lesions with high signal density (75 HU) within the normal fatty marrow (black arrows). (b) The lesions can be missed in the corresponding CT reformation in the bone window setting. (c, d) The focal lesions exhibit a hypointense signal in the corresponding coronal T1w MRI scan and a hyperintense signal in the T1w fat-saturated scan (white arrows)

