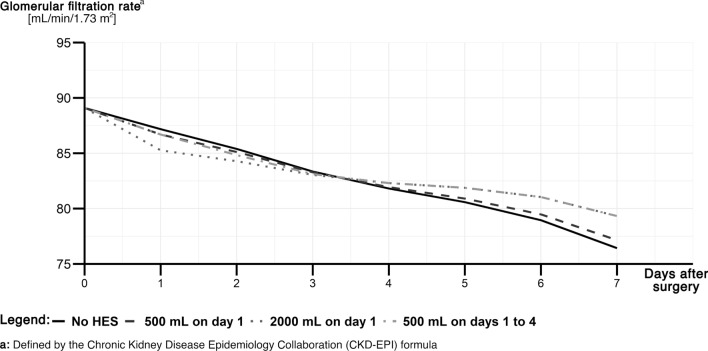
Fig. 3.
Predicted estimated glomerular filtration rate (eGFR) trajectory (mL/min/1.73 m2) every 24 h after surgery for a situation of a patient with median values in each covariate (Table S9 of the ESM). Different administration schemes are projected in scenarios with no hydroxyethyl starch 130/0.42 (HES) [black solid line], 500 mL of HES on day 1 (dark gray dashed line), 2000 mL of HES on day 1 (medium gray dotted line), and each 500 mL of HES on days 1–4 (light gray dot-dashed line)

