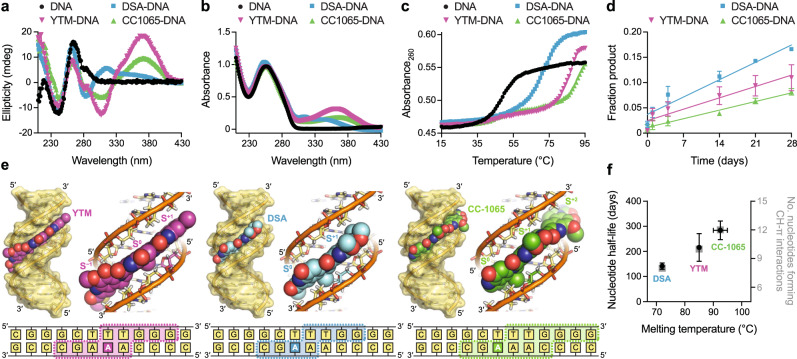
Fig. 2. Characterization of DNA adducts produced by YTM, DSA, and CC-1065.
a, b Circular dichroism (a) and absorbance (b) spectra of unmodified and alkylated DNA collected at 15 °C. c Thermal melting profiles of unmodified and alkylated DNA. Melting temperatures (Tm,DNA = 49 °C, Tm,DSA-DNA = 72 °C, Tm,YTM-DNA = 85 °C, and Tm,CC1065-DNA ≥ 90 °C) were determined by fitting the data to a polynomial function and calculating the inflexion point of the curve. Spectra and melting profiles for unmodified DNA and YTM-DNA were previously described by Mullins et al.18. d Spontaneous depurination of alkylated DNA at 30 °C. The data were fit to a linear model and half-lives (t1/2,DSA-DNA = 142 ± 11 days, t1/2,YTM-DNA = 224 ± 56 days, and t1/2,CC1065-DNA = 288 ± 36 days) were calculated assuming first-order kinetics. Data are presented as the mean ± SD from three replicate experiments. e Hypothetical models of DNA modified by YTM, DSA, and CC-1065. The dashed boxes indicate nucleotides that are predicted to form CH-π interactions with the SCPCHD adducts. f Correlation between melting temperature, rate of spontaneous depurination (plotted as nucleotide half-life), and number of nucleotides forming CH-π interactions, derived from c, d, and e, respectively. Horizontal error bars represent uncertainty in the melting temperature of CC1065-DNA caused by the lack of an endpoint in the melting profile. As such, the estimated melting temperature of CC1065-DNA was plotted as the average value ± the range of values calculated assuming endpoints between those of unmodified DNA (minimum) and DSA-DNA (maximum). Nucleotide half-lives are presented as the mean ± SD from three replicate experiments. Source data for a–d and f are provided as a Source Data file.

