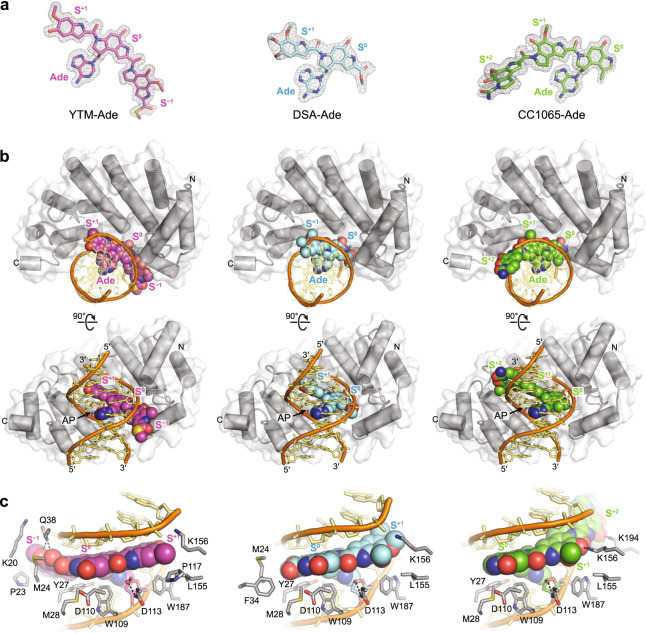
Fig. 5. Comparison of AlkD product complexes.
a Excised SCPCHD adducts from the crystallographic AlkD product complexes. Annealed omit mFo − DFc electron density maps are contoured to 3σ and carved around the omitted atoms with a 2 Å radius. b Orthogonal views of AlkD in complex with AP-DNA and either YTM-Ade (magenta), DSA-Ade (cyan), or CC1065-Ade (green). c Close-up views of the AlkD product complexes showing all residues that interact with the SCPCHD adducts. Hydrogen-bonding interactions are indicated with dashed lines. The structure of AlkD bound to AP-DNA and YTM-Ade (PDB accession 5UUG) was previously described by Mullins et al.18.

