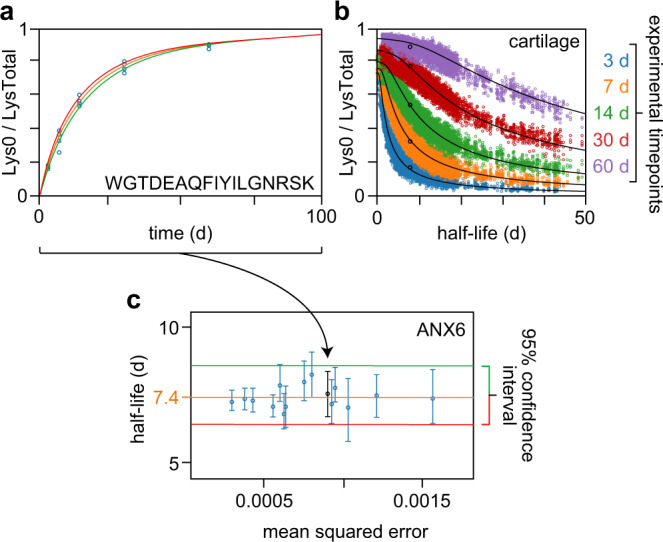
Fig. 2. Example output plots from ApplE Turnover.

a Experimental data (open blue circles) collected at the 3, 7, 14, 30, and 60 d timepoints for the peptide WGTDEAQFIYILGNRSK from the protein ANX6 in cartilage. The y axis indicates the relative fraction of this peptide that contains unlabeled (i.e., new) lysine (Lys0/LysTotal, where LysTotal is the sum of Lys0 and Lys8 quantities). ApplE Turnover uses these data to generate a model fit (orange curve) and 95% confidence interval (bound by the red and green curves). b Data for all quantified peptides in cartilage. Black curves indicate the model fits for this tissue; black open circles indicate the mean relative lysine fractions for the WGTDEAQFIYILGNRSK peptide at its calculated half-life of 7.5 d. c Half-lives for ANX6-derived peptides in cartilage plotted as a function of mean squared error (of the model fit); the WGTDEAQFIYILGNRSK data are black and indicated by an arrow. The calculated half-life for ANX6 is 7.4 d (orange line); the 95% confidence interval is bound by the red and green lines. The peptide half-life data are plotted as the best model fit to all observations of a given peptide ± the 2.5th and 97.5th percentile values from 200 simulations per peptide, based on a minimum of six peptide observations (of which at least three occurred at a single experimental timepoint), from a pool of n = 22 biologically independent samples. Source data are provided with this paper; raw mass spectrometry data are available as described in the “Data Availability” section.
