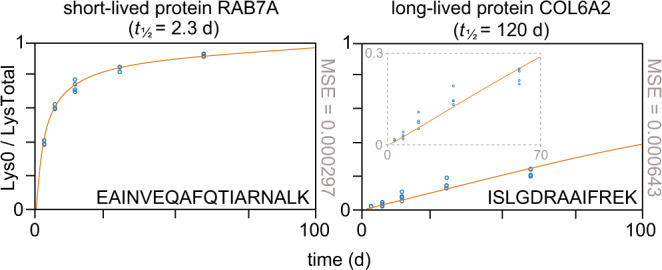
Fig. 5. Differences in model fit for short- and long-lived proteins.

Relative lysine fractions (open blue circles) and model fits (orange curves) for peptides from representative short- (RAB7A) and long-lived (COL6A2) proteins. The mean squared error (MSE) for each model fit is shown to the right of each plot. The model fits well to most peptide data, as illustrated for RAB7A, but fits poorly to long-lived proteins. In such cases, as shown for COL6A2, the model tends to underestimate Lys0 incorporation at 14 and 30 d, while overestimating it at 60 d (see inset). One explanation for this observation is that only a fraction of the long-lived protein is turning over while the remainder is static. Source data are provided with this paper; raw mass spectrometry data are available as described in the “Data Availability” section.
