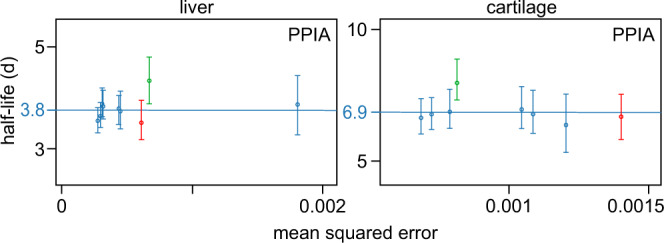
Fig. 6. Comparison of proteoform half-lives.

Half-lives for PPIA-derived peptides in liver and cartilage, plotted as a function of mean squared error (of the model fit); calculated half-lives for PPIA are indicated by horizontal lines. The N-terminal peptide of PPIA with acetylation (green) exhibits a longer half-life than the non-acetylated form of the same peptide (red), in both liver and cartilage. Other peptides from PPIA (blue) do not contain the N-terminus and so may be from the modified or unmodified proteoform. The peptide half-life data are plotted as the best model fit to all observations of a given peptide ± the 2.5th and 97.5th percentile values from 200 simulations per peptide, based on a minimum of six peptide observations (of which at least three occurred at a single experimental timepoint), from a pool of n = 22 biologically independent samples. Source data are provided with this paper; raw mass spectrometry data are available as described in the “Data Availability” section.
