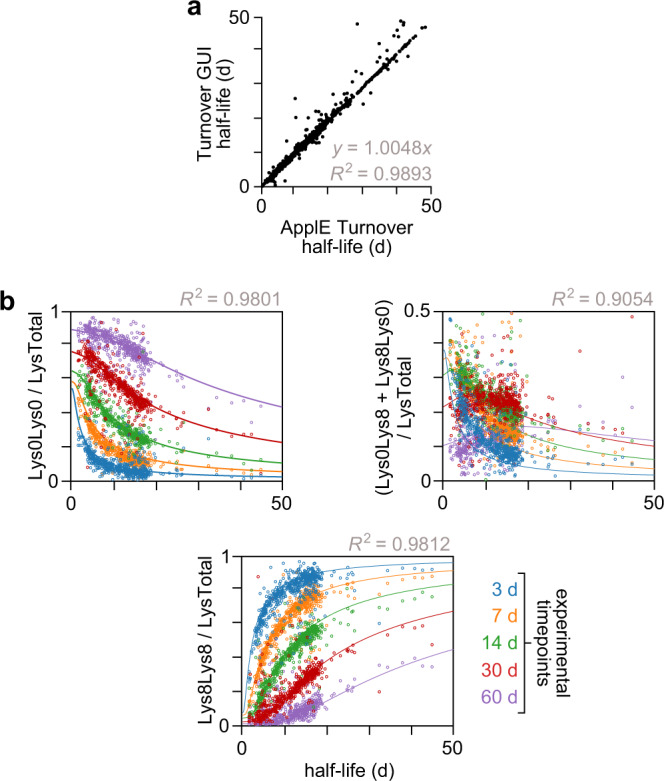
Fig. 7. Validation of ApplE Turnover.

a Comparison of calculated peptide half-lives in cartilage, generated by ApplE Turnover and Turnover GUI. b Relative fractions of the three isotopic label combinations (Lys0Lys0, Lys0Lys8, Lys8Lys8) of missed cleavage peptides in cartilage, as a function of peptide half-life. The expected values for each experimental timepoint are plotted as solid curves; the observed data are matched-color open circles. Note that each of these missed cleavage plots is analogous to the single plot in Fig. 2b, which shows the relative fraction of unlabeled lysine (Lys0) for all peptides in cartilage. Results from other tissues are shown in Supplementary Figs. 7 and 8. Source data are provided with this paper; raw mass spectrometry data are available as described in the “Data Availability” section.
