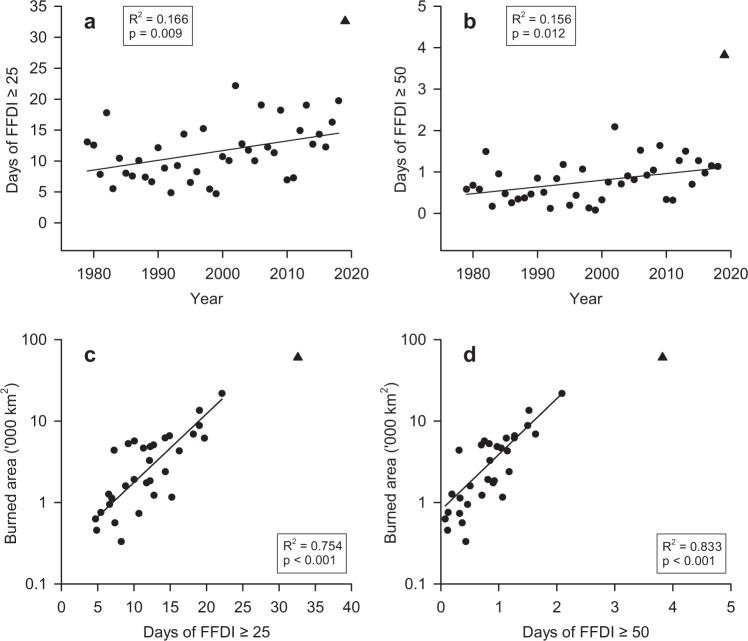
Fig. 6. Trends in the number of days with very high or severe Forest Fire Danger Index.
Trends in the number of days in which Forest Fire Danger Index (FFDI) equals or exceeds (a) 25, linear fit, or (b) 50, linear fit, over the fire years of 1979 to 2018 and averaged over forest ecosystems in Australia (Supplementary Table 1). Relationship between FFDI (c) ≥ 25 (exponential fit) and (d) ≥50 (exponential fit) and burned area for the fire years of 1988 to 2019 (Supplementary Table 1, Supplementary Fig. 6c,d). 2019 fire year (triangle). Burned area data: NOAA-Landgate (1988–2019).

