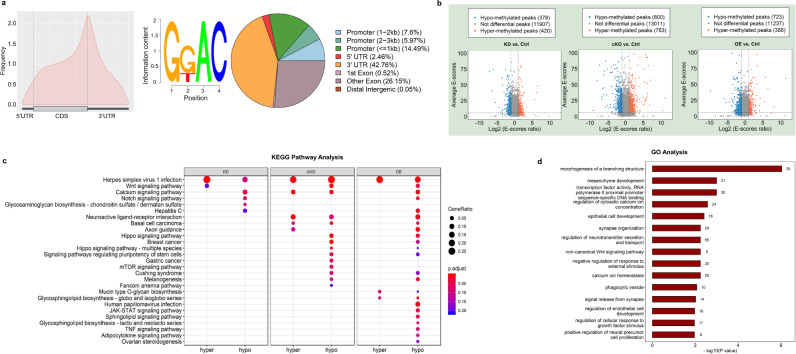
Fig. 3. Hippocampal m6A epitranscriptome modified by FTO.
a Left: distribution of m6A peaks throughout the whole mRNA transcript; middle: the most abundant motifs detected in peaks and enriched at peak summits; right: annotation of peaks detected in cKO mice. b Differentially methylated peaks among different groups. c KEGG pathway analysis of differentially methylated genes in different groups. d GO analysis of genes with hypomethylated peaks in OE mice.

