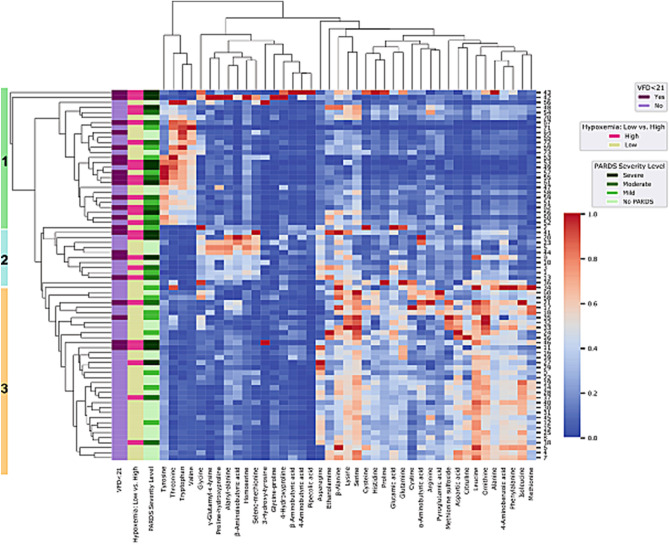
Figure 1.
Hierarchal cluster analysis of metabolites into three patient clusters. Children with and without pediatric acute respiratory distress syndrome (PARDS) are in blue (no PARDS) and in orange (with PARDS). Children with low hypoxemia (no or mild PARDS) are in yellow and those with high hypoxemia (moderate or severe PARDS) are in magenta. Children with no, mild, moderate, or severe PARDS are shown in green from lightest (no PARDS) to darkest (severe PARDS). Children with ventilator-free days (VFD) < 21 days (more than 7 days on a ventilator or death) are in dark purple and those with VFD ≥ 21 days are in light purple. Cluster assignments are denoted by the green (cluster 1), blue (cluster 2), and orange (cluster 3) bar to the left of the participant dendrogram.

