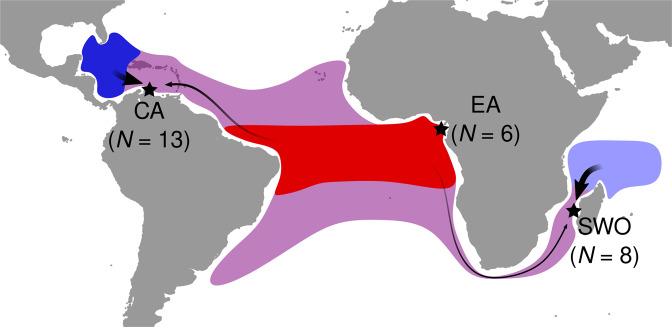
Fig. 1. Map showing the sampling locations (stars) and sample sizes per location used in the present study: Caribbean (CA), East Atlantic (EA) and Southwest Indian Ocean (SWO) as well as a proposed phylogeography based upon the findings of the present and previous studies (Encalada et al. 1996; Bourjea et al. 2007; Naro-Maciel et al. 2014; Jensen et al. 2019).
The hypothetical distribution of an ancestral population during the last interglacial period (130–115 kya) is shown in purple. Arrows indicate post-glacial range expansion and gene flow. Arrow size is proportional to the relative amount of gene flow.

