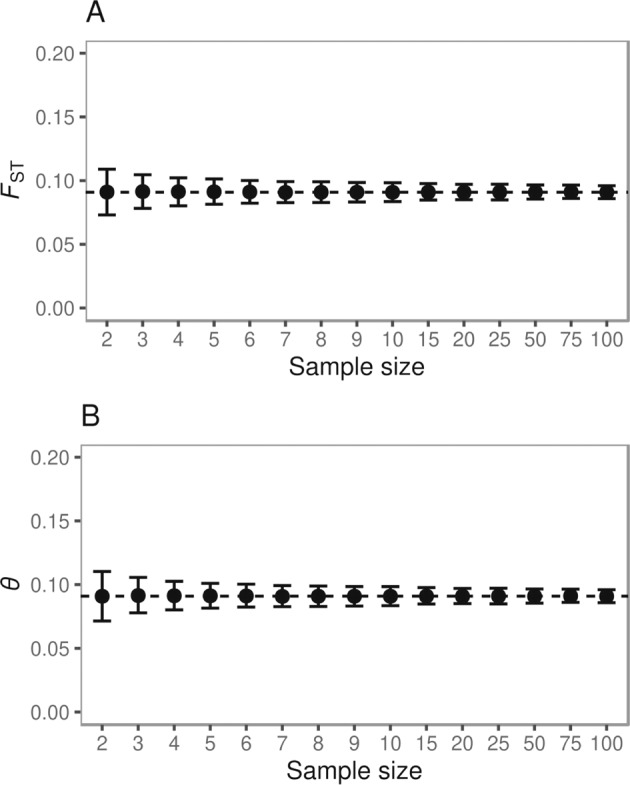
Fig. 3. Genetic differentiation as a function of sample size based upon simulated data.

Genetic differentiation was estimated as pairwise FST using (A) Hudson’s FST estimator and (B) Weir & Cockerham’s θ. The dashed line denotes the expected FST (~0.091). Filled circles denote the mean FST and error bars show the 95% confidence interval derived from 1000 replicate simulations per sample size.
