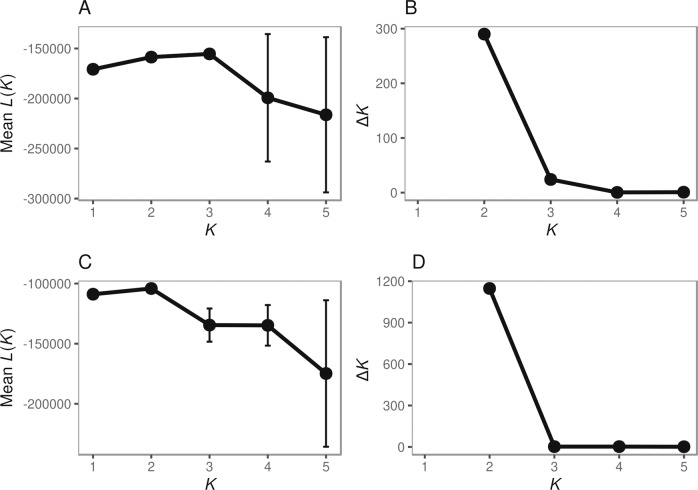
Fig. 4. Mean likelihood of K (left; A and C) and ∆K (right panels; B and D) for up to K = 5 clusters with 15 replicates per K estimated using STRUCTURE.
Error bars depict standard deviations. Top panels (A and B): full data (N = 27); bottom panels (C and D): full data, Atlantic samples only (N = 19).

