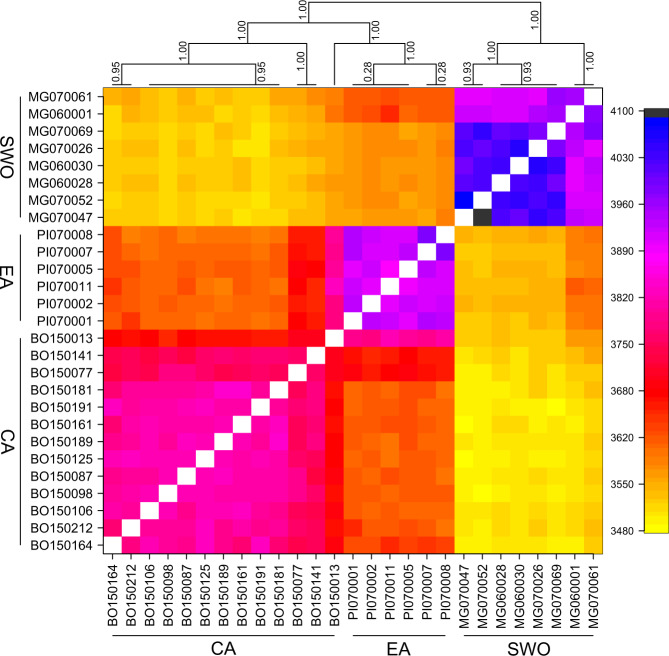
Fig. 6. Co-ancestry matrix showing the degree of shared ancestry among Caribbean (CA), East Atlantic (EA) and Southwest Indian Ocean (SWO) samples.
The scale values represent the total co-ancestry, i.e., the local co-ancestries summed across RAD loci (Malinsky et al. 2018). Higher co-ancestry values imply a higher degree of genetic similarity between sample pairs. A tree depicting the relative degree of co-ancestry among samples is shown above the co-ancestry matrix. Posterior support values are shown for each node.

