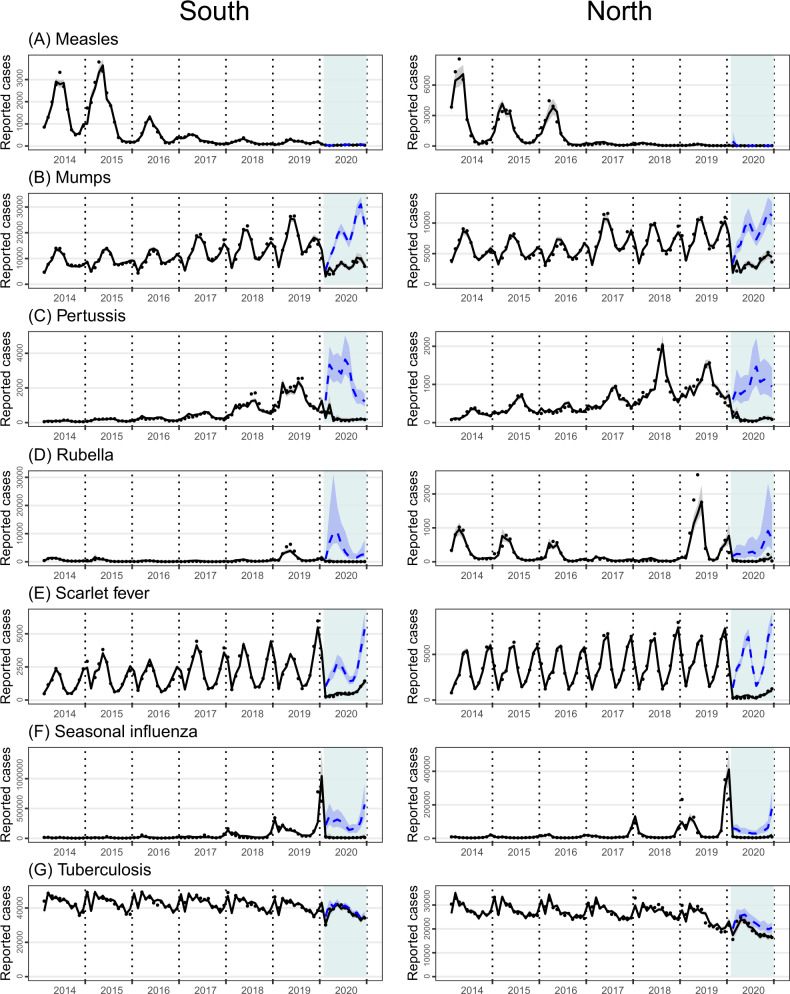
Fig. 2. Time series of observed (black dots) and GLM-projected monthly numbers of reported cases for selected respiratory diseases.
A Measles, B mumps, C pertussis, D rubella, E scarlet fever, F seasonal influenza, G tuberculosis. The model-projected trajectories are shown for both with (black solid) and without (blue dash, 2020 only) nonpharmaceutical interventions. Intervention phases II–IV (Feb–Dec) in 2020 are colored light blue. For the counterfactual trajectory without NPIs, monthly volumes of outpatient visits in 2020 were assumed the same as in 2019.

