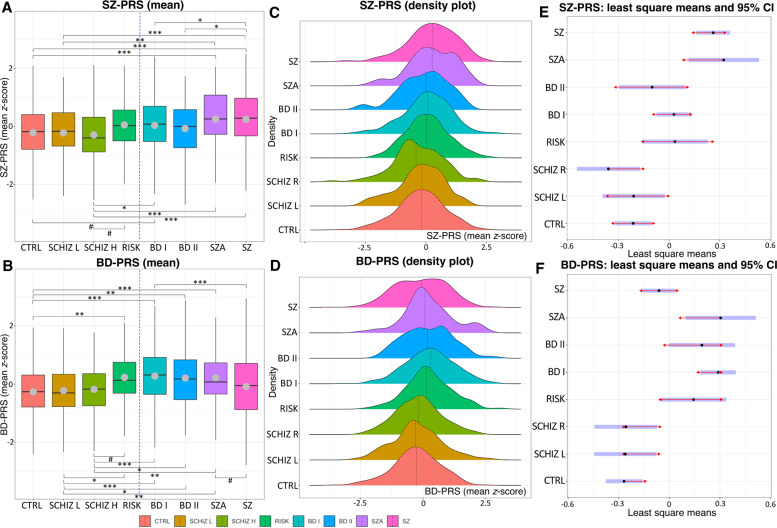
Fig. 1. Mean polygenic risk score (PRS) for schizophrenia (SZ-PRS) and bipolar disorder (BD-PRS) in the eight investigated groups.
A, B Each boxplot shows the median (vertical lines) and mean (gray dots) PRS values; whiskers represent the minimum and maximum values; the vertical blue dashed lines separate the groups with subclinical versus clinical symptomatology; brackets with symbols indicate significantly different pairwise Bonferroni-corrected comparisons at p < 0.05 (*), p < 0.01 (**), and p < 0.001 (***) thresholds as well as comparisons trending toward significance (#, adjusted p value range, 0.050–0.064). The results are adjusted for age, sex, and the first five ancestry principal components. Higher scores indicate a higher polygenic burden. C, D The vertical dotted lines within the colored distributions represent the mean PRS for each group. E, F The blue bars represent confidence intervals for each group’s least squares mean. If the red arrows for two groups overlap, the difference is not significant after a Bonferroni correction. Group abbreviations: BD I bipolar I disorder, BD II bipolar II disorder, CTRL control, RISK at-risk state for psychosis, SCHIZ H higher schizotypy, SCHIZ L lower schizotypy, SZA schizoaffective disorder, SZ schizophrenia.

