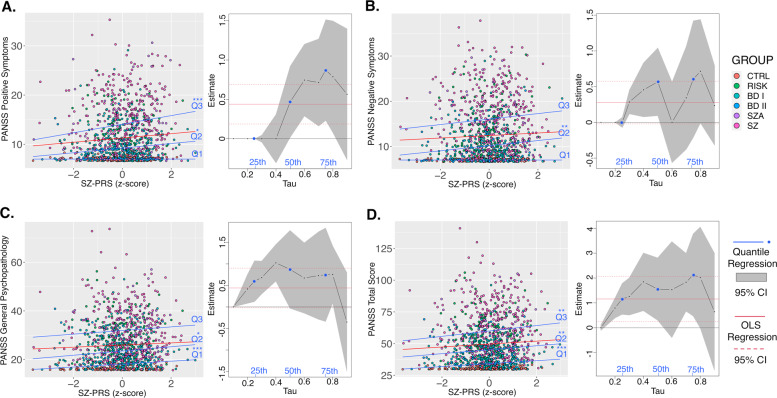
Fig. 3. Quantile regression analysis of schizophrenia polygenic risk score (SZ-PRS) predicting symptoms.
Three quantiles of symptom score distributions (Q1 = 0.25, Q2 = 0.50, Q3 = 0.75) included three dimensions (A–C) and the total score (D) of the Positive and Negative Syndrome Scale (PANSS). The quantile regression estimates are visualized at 0.1 increments as black lines and with corresponding confidence intervals (CIs) shown as the gray shaded areas. The Q1, Q2, and Q3 quantiles are depicted in blue. For comparison, the ordinary least squares (OLS) regression estimates are shown as red solid lines with their CIs as dashed red lines. Many quantile estimates fell within the CI of the OLS regression slope, indicating overlap (though OLS does not adequately address the floor effect). *p < 0.05; **p < 0.01; ***p < 0.001. There were no significant results for BD-PRS. Group abbreviations: BD I bipolar I disorder, BD II bipolar II disorder, CTRL controls, RISK at-risk state for psychosis, SCHIZ L lower schizotypy, SCHIZ H higher schizotypy, SZA schizoaffective disorder, SZ schizophrenia.

