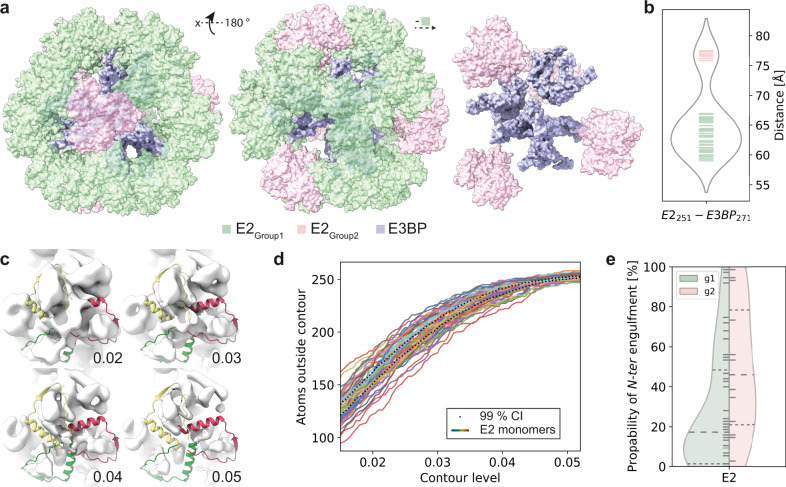
Fig. 4. Structural impact of E3BP localization on the E2 core.
a Binary classification of E2 proximity to the E3BP. Proximal E2 monomers are colored green, whereas distal are colored pink. b Violin plot showing the distribution of distances of each E2 to the closest E3BP. Two groups are retrieved: Group 1, in the range of 55 to 70 Å, and Group2, in the range of more than 75 Å. c Enclosure of the backfolded element corresponding to the N-ter region of the E2 at different map contour levels (0.02–0.05). d Number of atoms from the N-ter backfolded element not covered by the cryo-EM map density as a function of applied contour level. The 99% confidence interval (CI) is displayed as dotted lines. e Grouped violin plot showing the probability of additional density to encapsulate the N-ter backfolded element in the two distinct Groups. Group 1 (g1), represents vicinal E2 monomers to E3BPs that have a substantially lower probability to exhibit densities that may cover the N-ter backfolded element. Dashed lines indicate lower and higher quartile and median values.

