Figure 3.
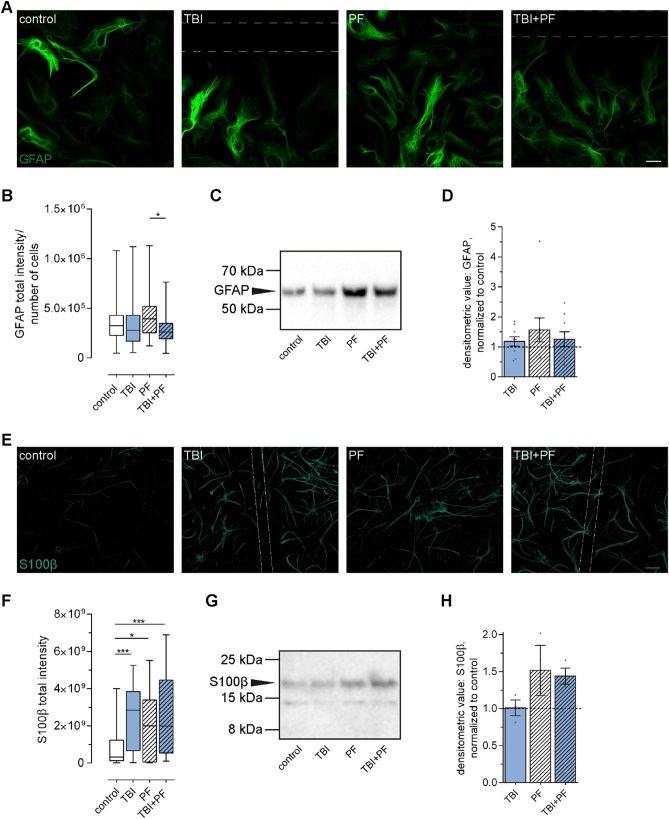
Differential expression of the astrocytic markers GFAP and S100β following Aβ42 protofibril and TBI exposure. (A) Representative images of the astrocytes (GFAP) in culture showing a wide range of GFAP expression across all experimental groups. The sites of the mechanically induced scratch injury are indicated by the dashed lines. (B) The corresponding quantification determined a trend towards higher GFAP fluorescence intensity in Aβ42 protofibril-exposed astrocytes, with a statistically significant difference compared to the double exposure (TBI + PF). Ten images per independent cell culture (n = 3) and experimental group were analyzed and reported. (C,D) Western blot analysis also pointed towards an increase in GFAP expression in the PF group (the control group is represented by the dashed line at 1); mean ± SEM (independent cell cultures, n = 9). (E) Representative images of cell cultures stained for the astrocytic marker S100β and (F) the quantification of S100β fluorescence intensity. All exposures caused an upregulation of S100β expression. Ten images per independent cell culture (n = 4) and experimental group were analyzed and reported. (G,H) The follow-up western blot analysis also pointed towards an increase in S100β expression for the PF and TBI + PF groups compared to control (represented by the line at 1.0); mean ± SEM (independent cell cultures, n = 3). Statistical analyses of GFAP and S100β fluorescence intensities and GFAP Western blot data were performed using the Kruskal–Wallis test followed by Dunn’s multiple comparisons test. Western blot of S100β expression was analyzed using one-way ANOVA followed by Tukey’s multiple comparison test, *p ≤ 0.05 **p ≤ 0.01 ***p ≤ 0.001. Scale bars 20 µm (A) and 30 µm (E).

