Figure 6.

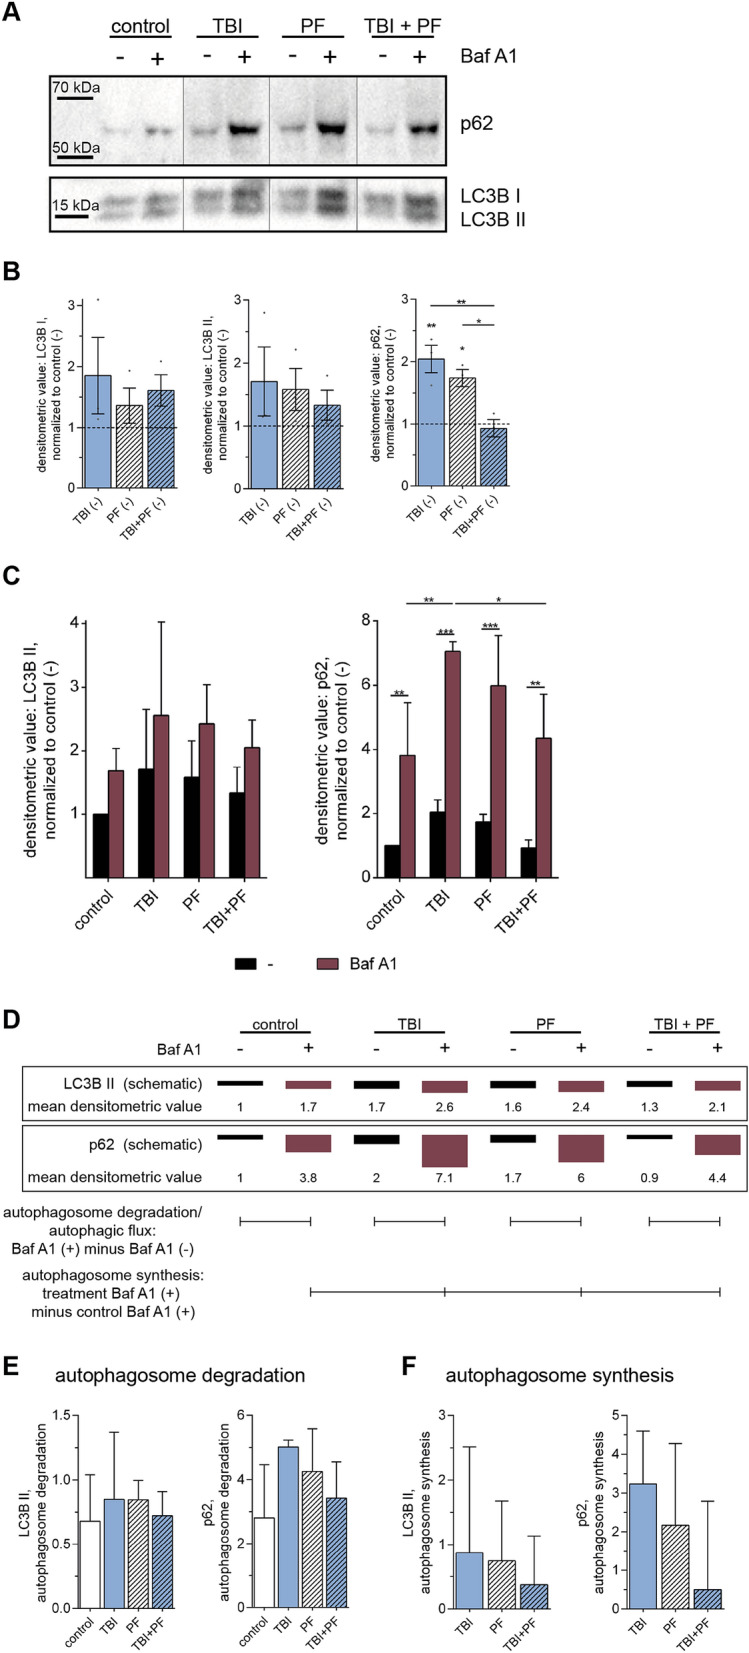
Upregulated autophagic activity in the TBI and PF groups, but not in TBI + PF. (A) The autophagy-related proteins p62 and LC3B II can be used as reporters to measure autophagic activity by immunoblotting. Usage of the autophagy inhibitor Baf A1 allows the evaluation of autophagic flux. Experiments were performed on cell lysates of three independent cell cultures and representative blots are shown. (B) LC3B I, LC3B II and p62 bands detected on the immunoblots were quantified from three independent experiments and the obtained densitometric values are displayed as mean ± SEM. (C) Static observations of the cellular levels of LC3B and p62 cannot be used to draw conclusions about the actual lysosomal turn-over. However, when comparing the results in the absence (−) and presence of the inhibitor Baf A1 we determined an increase in autophagic flux. (D) Schematic representation of the data shown in (C). Mean values are presented and were used to illustrate how autophagosome synthesis and degradation can be calculated. (E) The amount of autophagosomes that would have been degraded shows a tendency for an increase in the TBI and PF groups, but not in TBI + PF. (F) Correspondingly, autophagosome synthesis calculations showed the same trend, though also not statistically significant. Data in (C), (E) and (F) are displayed as mean with SD and were obtained from three independent cell cultures. Statistical analysis was performed using one-way ANOVA (B,E,F) and two-way ANOVA (C) followed by Tukey’s multiple comparison tests, *p ≤ 0.05 **p ≤ 0.01 ***p ≤ 0.001.
