Figure 7.
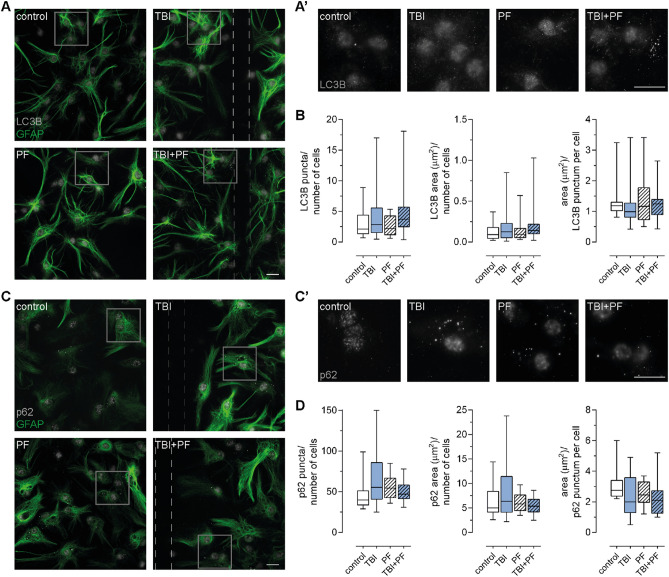
Immunocytochemistry confirms that the autophagy-lysosomal pathway is not impaired. (A) Immunostaining for LC3B and astrocytes (GFAP) were performed and representative fluorescence microscopy images are shown. (B) The number of LC3B puncta and their total area as well as the area per single LC3B-positive punctum were quantified. While the analysis did not reveal statistically significant differences, it was observed that some cells, in cultures that had undergone TBI alone or in combination with Aβ42 protofibril exposure, possessed higher amounts of LC3B puncta and subsequently also a greater total area measurement. (C) Representative images of cultures stained for p62 and astrocytes (GFAP) and (D) the quantification of p62 puncta, total area measurement and area per single p62-positive punctum. Again, cells in the TBI group occasionally possessed a much higher number of p62 puncta and total area measurement, albeit no statistically significant difference. The general tendency for an increase in p62 expression in the TBI and PF groups, observed in the immunoblotting data, was also identified in this image analysis. (A′,C′) Magnifications of the areas outlined in (A) or (C) are presented. Ten or five (LC3B and p62, respectively) images per independent cell culture (n = 2) per experimental group were analyzed and reported. Statistical analysis was performed using the Kruskal–Wallis test followed by Dunn’s multiple comparisons test, *p ≤ 0.05 **p ≤ 0.01 ***p ≤ 0.001. Scale bars 20 µm.

