Figure 8.
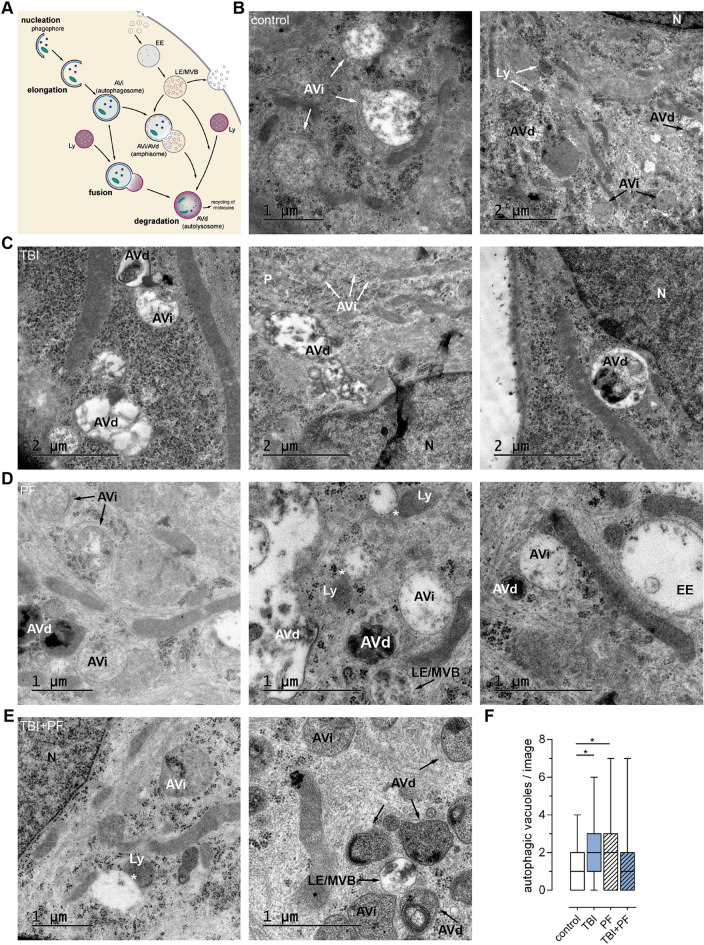
Autophagic and endocytic compartments depicted by transmission electron microscopy. (A) Schematic depiction of the autophagic and endocytic pathways used by the cells for the degradation and recycling of material. (B–E) TEM images of control (B), TBI (C), PF (D) and TBI + PF (E) cells. Autophagic and endocytic vacuoles at various stages of maturation are denoted. (F) The number of autophagic vacuoles (AVi and AVd) per TEM image was quantified; analyzing a total of 55–68 TEM images of five cells per experimental group. Statistical analysis was conducted using the Kruskal–Wallis test followed by Dunn’s multiple comparisons test, *p ≤ 0.05 **p ≤ 0.01 ***p ≤ 0.001. Potential fusion events are marked by stars (*). Abbreviations used: AVd degradative autophagic vacuole/autophagic compartment, AVi immature autophagic vacuole/autophagosome, EE early endosome, LE late endosome, Ly Lysosome, MVB multivesicular body, N nucleus, P phagophore/isolation membrane.

