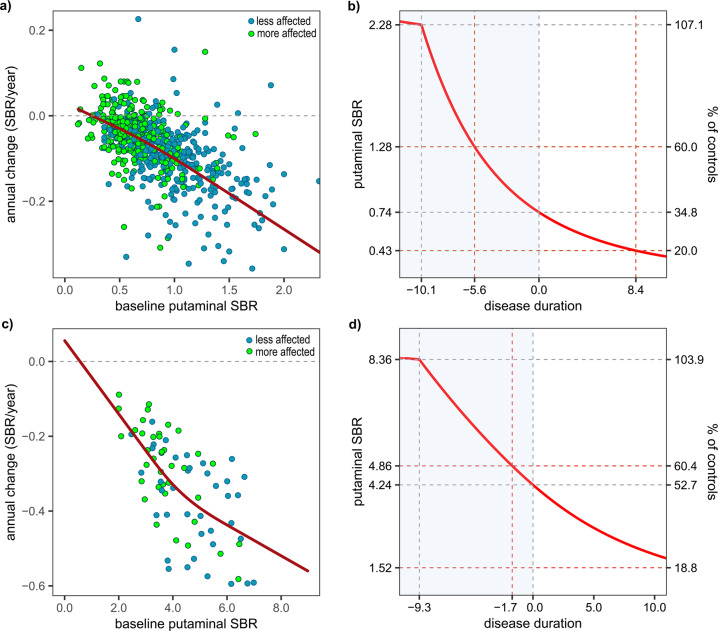
Fig. 2. Annual changes in putaminal DAT SBRs as a function of baseline levels and estimated temporal trajectories in sPD patients.
Fitted curves on the scatter plots were obtained with the RCS model in PPMI (a) (123I-FP-CIT SPECT) and GSH (c) (18F-FP-CIT PET) cohorts. Outliers beyond the first or third quartile ± 3 × interquartile range (5 putamen, sPD group of PPMI cohort) are not shown. All outliers were included in the calculation of temporal trajectories. Temporal trajectories in the PPMI (b) and GSH (d) cohorts were acquired with a modified Euler’s method for solving the first-order differential equation.

