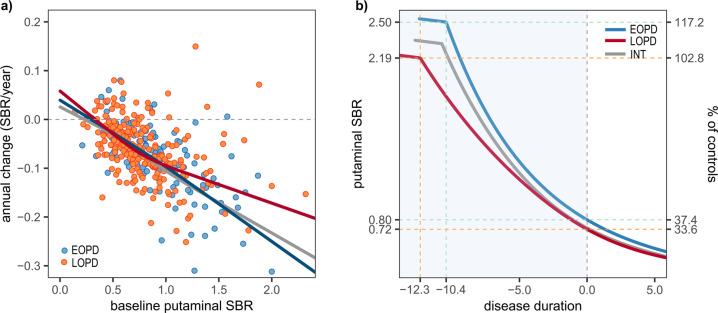
Fig. 3. Comparison of annual change rates against baseline SBRs and DAT trajectories between EOPD, intermediate-onset, and LOPD groups in the PPMI cohort.
a sPD patients with early and intermediate onset showed similar curves, but annual change rates in EOPD patients are lower within the range over 0.9 of the baseline SBR compared to the LOPD group. Outliers beyond the first or third quartile ± 3 × interquartile range were not shown (2 putamen, sPD group of PPMI cohort). All outliers were included in the calculation of temporal trajectories. b Estimated trajectory of the intermediate-onset group was close to EOPD group, however, EOPD patients show a shorter premotor phase and faster DAT decline during the premotor period than the LOPD group (B; INT = intermediate onset).

