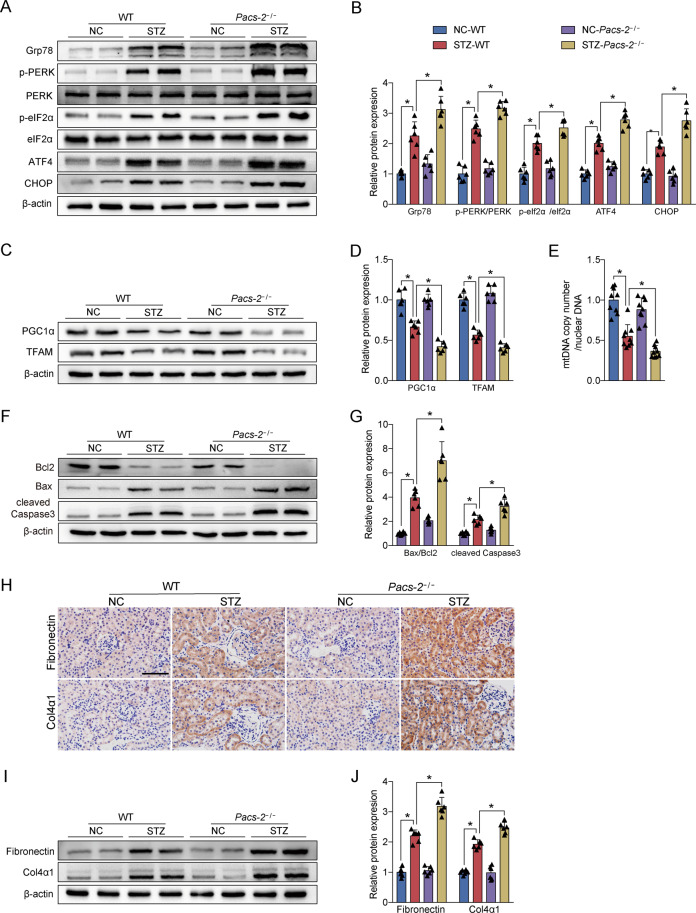
Fig. 3. Diabetes-associated ER stress, mitochondrial dysfunction, apoptosis, and fibrosis were exacerbated in PACS-2 knockout kidneys.
A Western blot bands of Grp78, p-PERK, PERK, p-eIF2α, eIF2α, ATF4, and CHOP in kidney lysates. B Quantitative analysis of indicated protein levels in A. n = 6. C Western blot bands of TFAM and PGC1α in kidney lysates. D Quantitative analysis of indicated protein levels in C. n = 6. E Measurement of mtDNA copy number normalized to the nuclear gene. n = 9. F Western blot bands of Bax, Bcl2, and cleaved Caspase3 in kidney lysates. G Quantitative analysis of indicated protein levels in F. n = 6. H Immunohistochemical staining of Fibronectin and Col4α1 in the kidney sections. Scale bar = 100 μm. I Western blot bands of Fibronectin and Col4α1 in kidney lysates. J Quantitative analysis of indicated protein levels in (I). n = 6. All data are expressed as mean ± SD. *P < 0.05.

