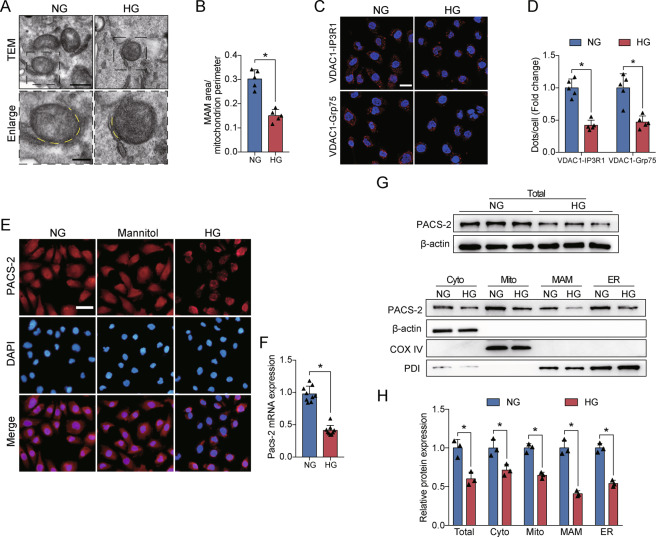
Fig. 6. HG altered MAM integrity and PACS-2 expression in vitro.
A Representative TEM images showing the MAM area in HK-2 cells. Yellow lines indicate the MAM interface. Scale bars = 500 nm, inset scale bar = 200 nm. B Quantitative analysis of MAM area normalized to mitochondrion perimeter in A. n = 5. C Representative in situ PLA images showing the VDAC1/IP3R1 or VDAC1/Grp75 complexes in HK-2 cells. Scale bars = 50 μm. D Quantitative analysis of in situ PLA dots in D. n = 5. E Immunofluorescence staining of PACS-2 in HK-2 cells. Scale bar = 50 μm. F RT-PCR analysis of Pacs-2 mRNA levels in HK-2 cells. n = 9. G Western blot bands of PACS-2 proteins in total lysates and subcellular fractions isolated from HK-2 cells. H Quantitative analysis of PACS-2 protein levels in G. n = 3. All data are expressed as mean ± SD. *P < 0.05.

