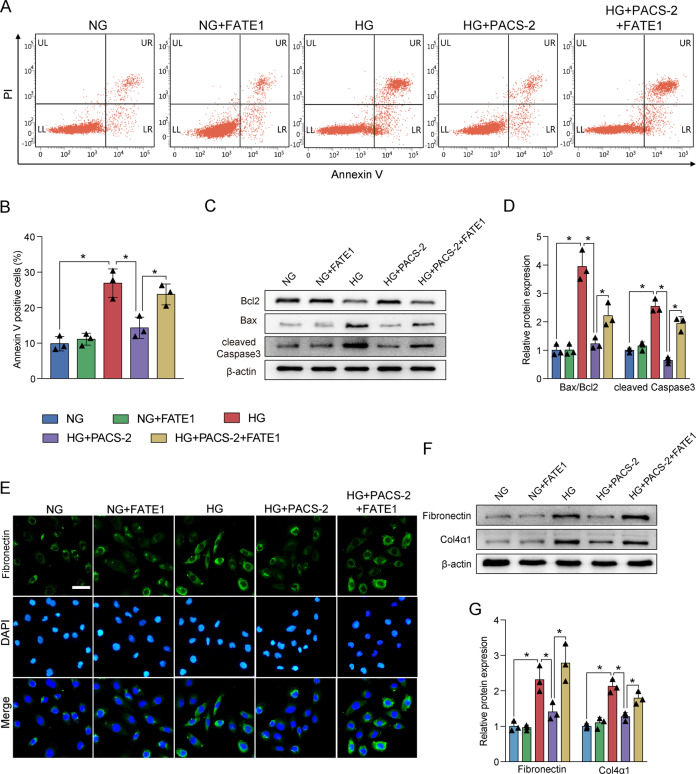
Fig. 8. MAM integrity was required for the suppression of HG-induced apoptosis and fibrosis.
A Representative images of flow cytometry in HK-2 cells. B Quantitative analysis of percent of apoptotic cells in A. n = 3. C Western blot bands of Bax, Bcl2, and cleaved Caspase3 in HK-2 cells. D Quantitative analysis of indicated protein levels in A. n = 3. E Immunofluorescence staining of Fibronectin in HK-2 cells. Scale bar = 50 μm. F Western blot bands of Fibronectin and Col4α1 in HK-2 cells. G Quantitative analysis of indicated protein levels in F. n = 3. All data are expressed as mean ± SD. *P < 0.05.

