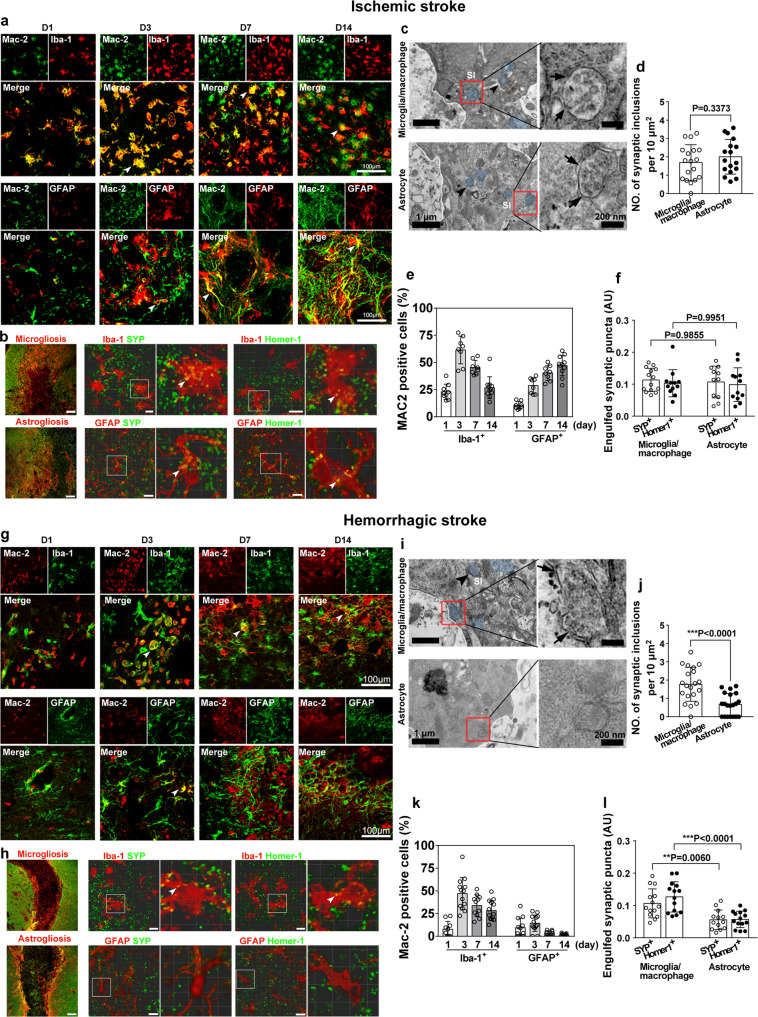
Fig. 1. Engulfment of synapses by microglia/macrophages and astrocytes in the gliosis region in ischemic and hemorrhagic stroke.
Representative single-plane images showed immunostaining of Iba-1 (green), GFAP (green), and Mac-2 (red) in the perifocal region at 1, 3, 7, and 14 days after ischemic stroke (a) and hemorrhagic stroke (g). Arrowheads indicate Mac-2 expression in glial cells. Bar = 100 µm. Percentage of Iba-1+/Mac-2+ and GFAP+/Mac-2+ cells at different time points after ischemic (e) and hemorrhagic stroke (k). b, f Confocal images showed presynaptic protein synaptophysin (SYP+, green) and postsynaptic protein Homer-1+ (green) were engulfed by Iba-1+ microglia/macrophages (red) and GFAP+ astrocytes (red) in the reactive gliosis region at 14 days after MCAO. Left panel, low magnification of gliosis region in ischemic striatum; glial cell, red; synapse, green. Arrowheads indicate engulfed synapses. Bar = 100 µm and 10 µm. c, d TEM images showed engulfed synapses (blue) were contained in the cytoplasm of microglia/macrophages and astrocytes in the gliosis region following MCAO. High magnification images (right panel) from the box showed the engulfed synaptic structures with multivesicular and irregular membrane morphology (arrows) in microglia/macrophages and astrocytes. Bar = 1 µm and 200 nm. h, l Confocal images showed SYP+ (green) and Homer-1+ (green) were engulfed by Iba-1+ microglia/macrophages (red) in the microgliosis area, but few SYP+ (green) and Homer-1+ (green) were detected in GFAP+ astrocytes (red) in the astrogliosis area in the hemorrhagic brain. Left panel, low magnification of gliosis region in hemorrhagic striatum, glial cell, red; synapse, green. Arrowheads indicate engulfed synapses in microglia/macrophages. Bar = 100 µm and 5 µm. i, j TEM images showed engulfed synapses (blue) localized in the cytoplasm of microglia/macrophages but not in astrocytes following hemorrhagic stroke. High-magnification images (right panel) from the box (left panel) showed the synaptic inclusions (arrow) in microglia/macrophages but not in astrocytes. Bar = 1 µm and 200 nm. SI synaptic inclusion, AU arbitrary units. Statistics are derived from 18, 17 cells (d) and 20, 20 cells (j) (from left to right), n = 3 mice per group. Statistics are derived from 9, 8, 8, 11, 8, 8, 8, 11 slices (e) and 10, 13, 11, 13, 12, 13, 10, 11 slices (k) (from left to right), n = 4 mice per group. Statistics are derived from 14, 12, 11, 12 slices (f) and 14, 14, 13, 14 slices (l) (from left to right), n = 4 mice per group. d, j two-sided, unpaired Student’s t test. f, l two-way ANOVA followed by Tukey’s test. Data are mean ± SD. Source data are provided as a Source Data file.

