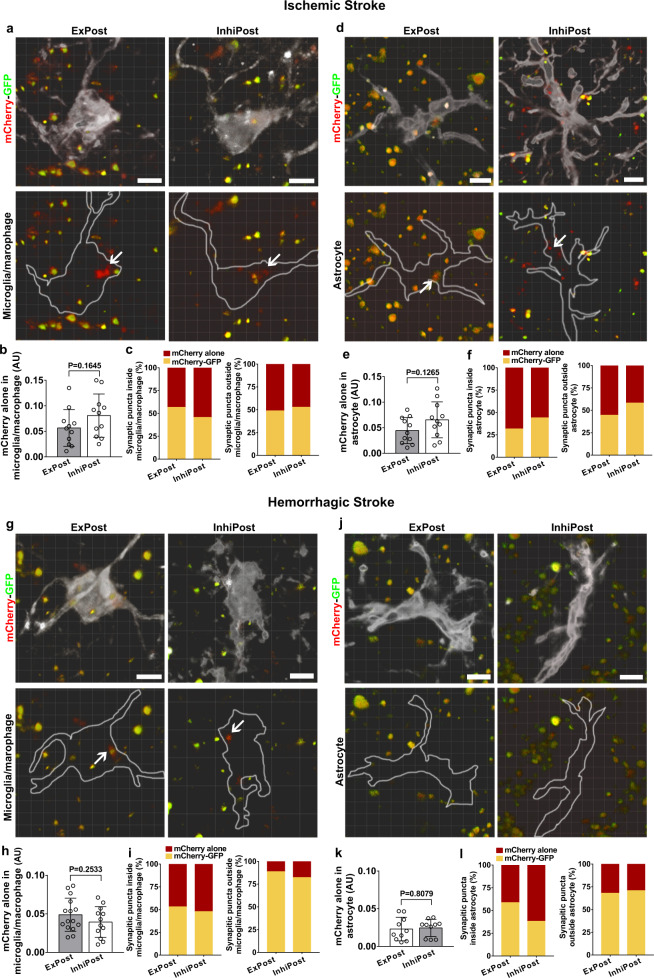
Fig. 2. Microglia/macrophages and astrocytes engulfed both excitatory and inhibitory synapses in stroke mice.
Colocalization assays showed microglia/macrophages (a, Iba-1+, white) and astrocytes (d, GFAP+, white) engulfed excitatory postsynaptic and inhibitory postsynaptic elements in the gliosis region at 14 days after MCAO. Arrows indicate mCherry-alone puncta within microglia/macrophages or astrocytes. Quantification comparing the volume of mCherry-alone synapses inside microglia/macrophages (b) or astrocytes (e). b, e Statistics are derived from 11 slices, n = 4 mice per group. Quantification showing the percentage of synaptic puncta inside/outside microglia/macrophages (c) or astrocytes (f) in the ischemic brain. Colocalization images showed mCherry-alone puncta within microglia/macrophages (g, white) or astrocytes (j, white) in the hemorrhagic brain. Quantification comparing the volume of mCherry-alone synapses inside microglia/macrophages (h) or astrocytes (k). Statistics are derived from 15, 12 slices (h) and 10, 10 slices (k) (from left to right), n = 4 mice per group. Quantification showing the percentage of synaptic puncta inside/outside microglia/macrophages (i) or astrocytes (l) in the hemorrhagic brain. Scale bar = 10 µm. ExPost excitatory postsynapse, InhiPost inhibitory postsynapse. AU arbitrary units. b, e, h, k, two-sided, unpaired Student’s t test. Data are mean ± SD.

